Fig. 1
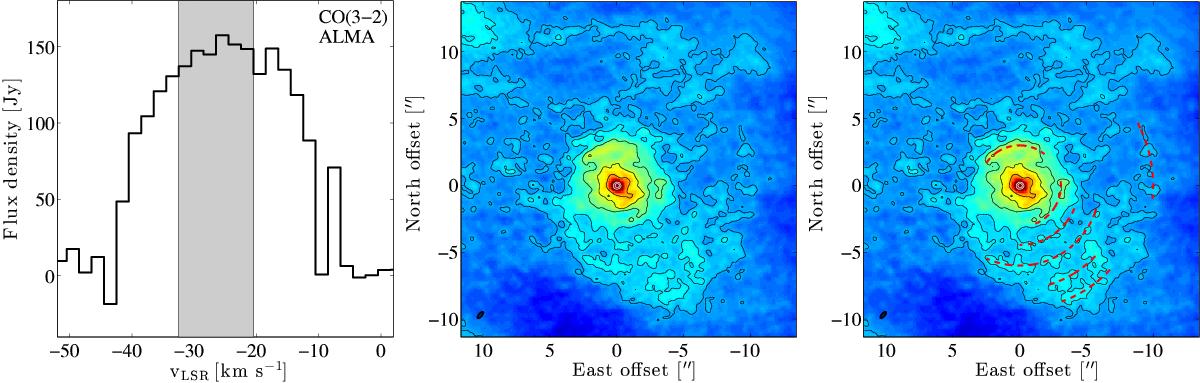
Left: ALMA CO(J = 3 → 2) emission line at 2 km s-1 spectral resolution. The dip at vLSR = −10 km s-1 is due to a bad channel (see Appendix A) and is not a real feature. The grey shaded area shows the averaged velocity range to create the image to the right. Middle: image average of the central channels of the line (grey shaded area in left plot). The image shows arc-like structures and increased emission on the south-west and west sides of the star. Black contours are drawn at 5, 10, 20, 30, and 40σ (where σ is measured over the emission-free channels). The white contours show the position of the AGB star from the continuum emission at 338 GHz. The beam is drawn in the lower left corner. Right: same as middle image with arcs outlined by red dashed lines.
Current usage metrics show cumulative count of Article Views (full-text article views including HTML views, PDF and ePub downloads, according to the available data) and Abstracts Views on Vision4Press platform.
Data correspond to usage on the plateform after 2015. The current usage metrics is available 48-96 hours after online publication and is updated daily on week days.
Initial download of the metrics may take a while.