Fig. 4
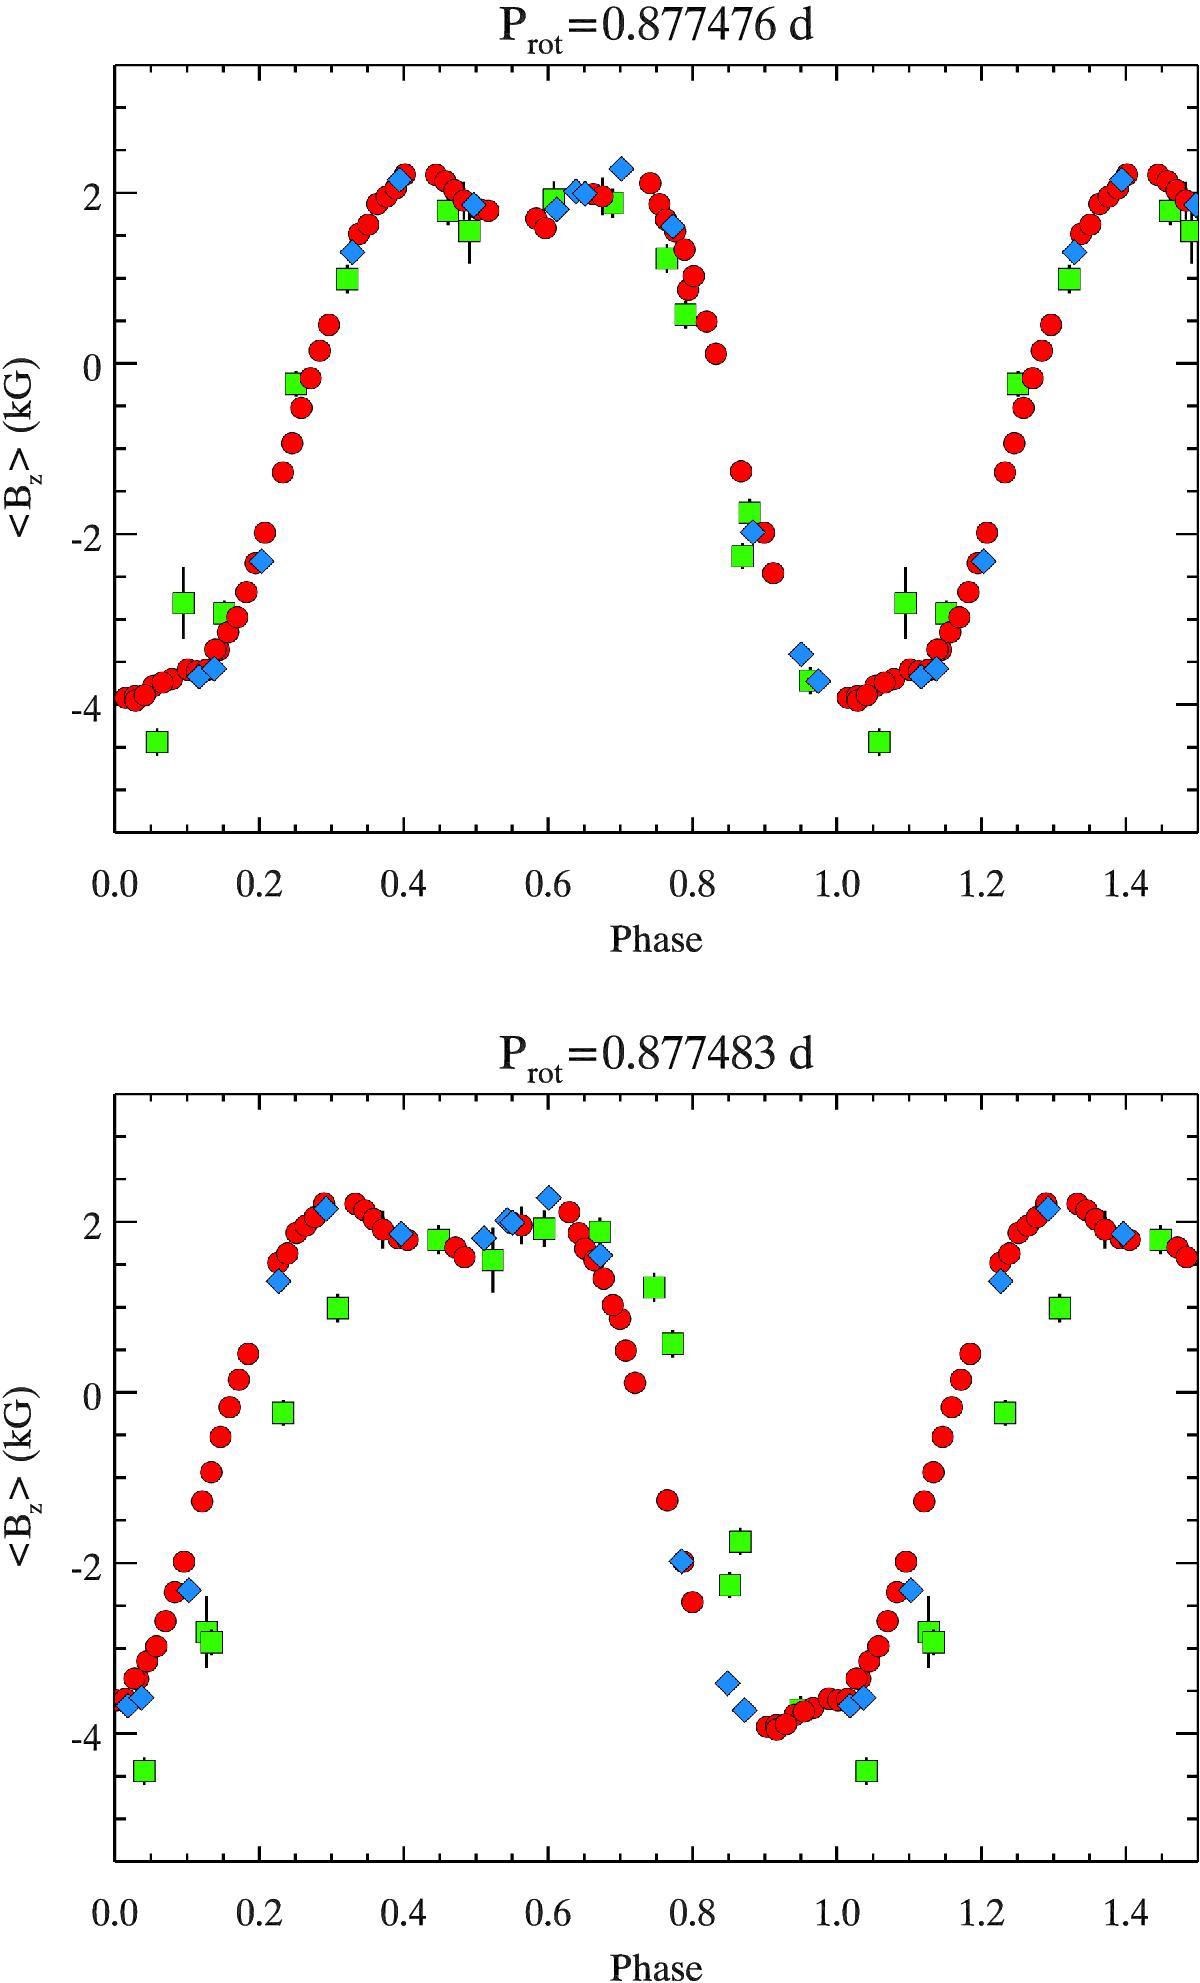
Variation of the mean longitudinal magnetic field of HR 5624. The dark symbols show ⟨ Bz ⟩ measurements derived in this study from the HARPSpol (red circles) and ESPaDOnS (blue rhombs) observations. The green squares show the Balmer line photopolarimetric measurements by Landstreet (1990). The upper and lower panels illustrate phasing of the ⟨ Bz ⟩ data with the rotational periods 0.877476 d and 0.877483 d, respectively.

Current usage metrics show cumulative count of Article Views (full-text article views including HTML views, PDF and ePub downloads, according to the available data) and Abstracts Views on Vision4Press platform.
Data correspond to usage on the plateform after 2015. The current usage metrics is available 48-96 hours after online publication and is updated daily on week days.
Initial download of the metrics may take a while.