Fig. 3
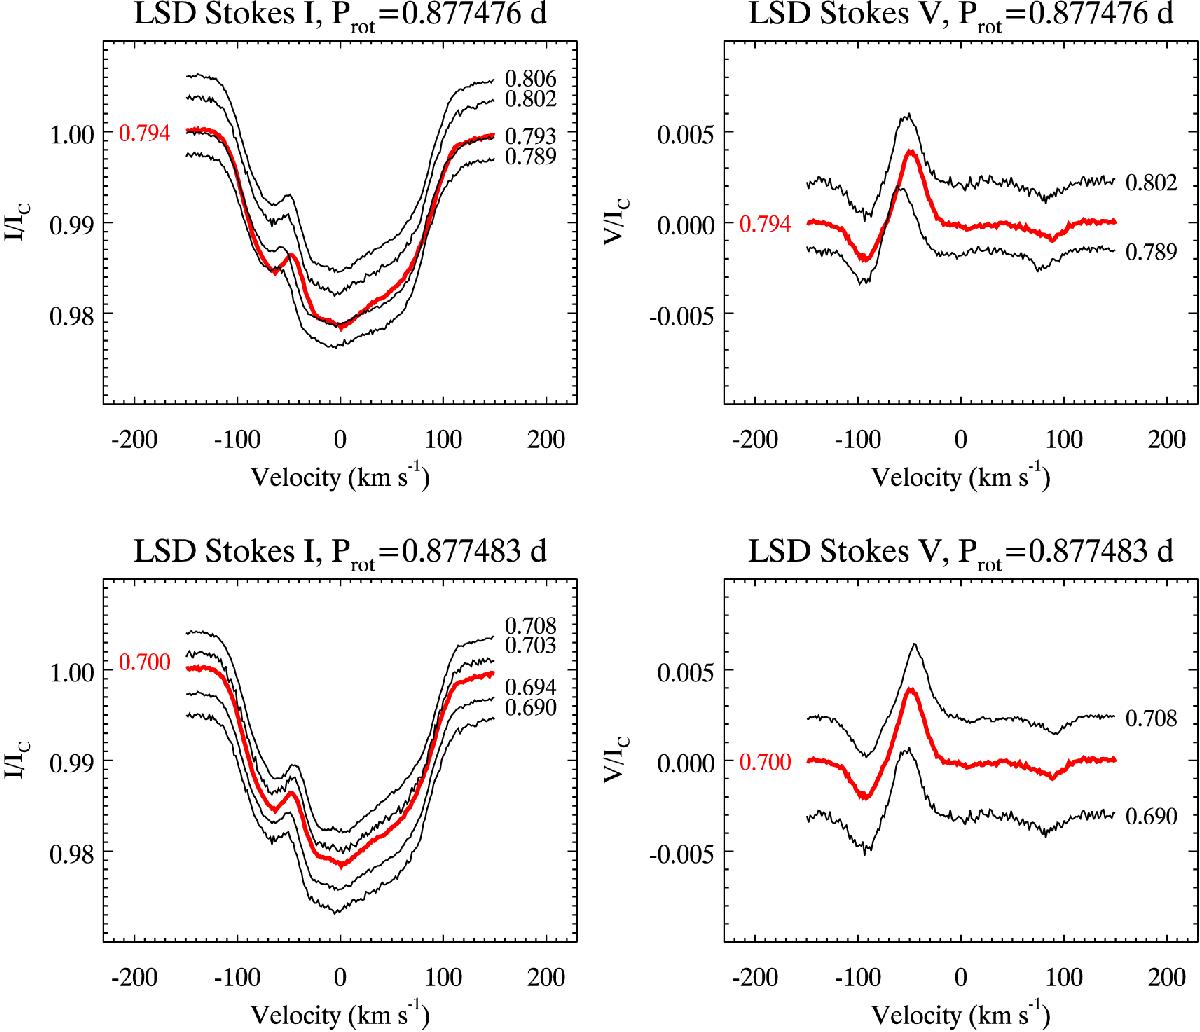
Relative phasing of the LSD Stokes I (left) and V (right) profiles corresponding to the archival HARPSpol observation of HR 5624 obtained in 2010 (thick, light/red curves) and observations collected in 2015 (thin, dark/black curves) for the rotational periods 0.877476 (top) and 0.877483 days (bottom). Profiles are shifted vertically according to the rotational phases, which are indicated to the right of the profiles for the 2015 data and to the left for the 2010 spectrum.
Current usage metrics show cumulative count of Article Views (full-text article views including HTML views, PDF and ePub downloads, according to the available data) and Abstracts Views on Vision4Press platform.
Data correspond to usage on the plateform after 2015. The current usage metrics is available 48-96 hours after online publication and is updated daily on week days.
Initial download of the metrics may take a while.