Fig. 18
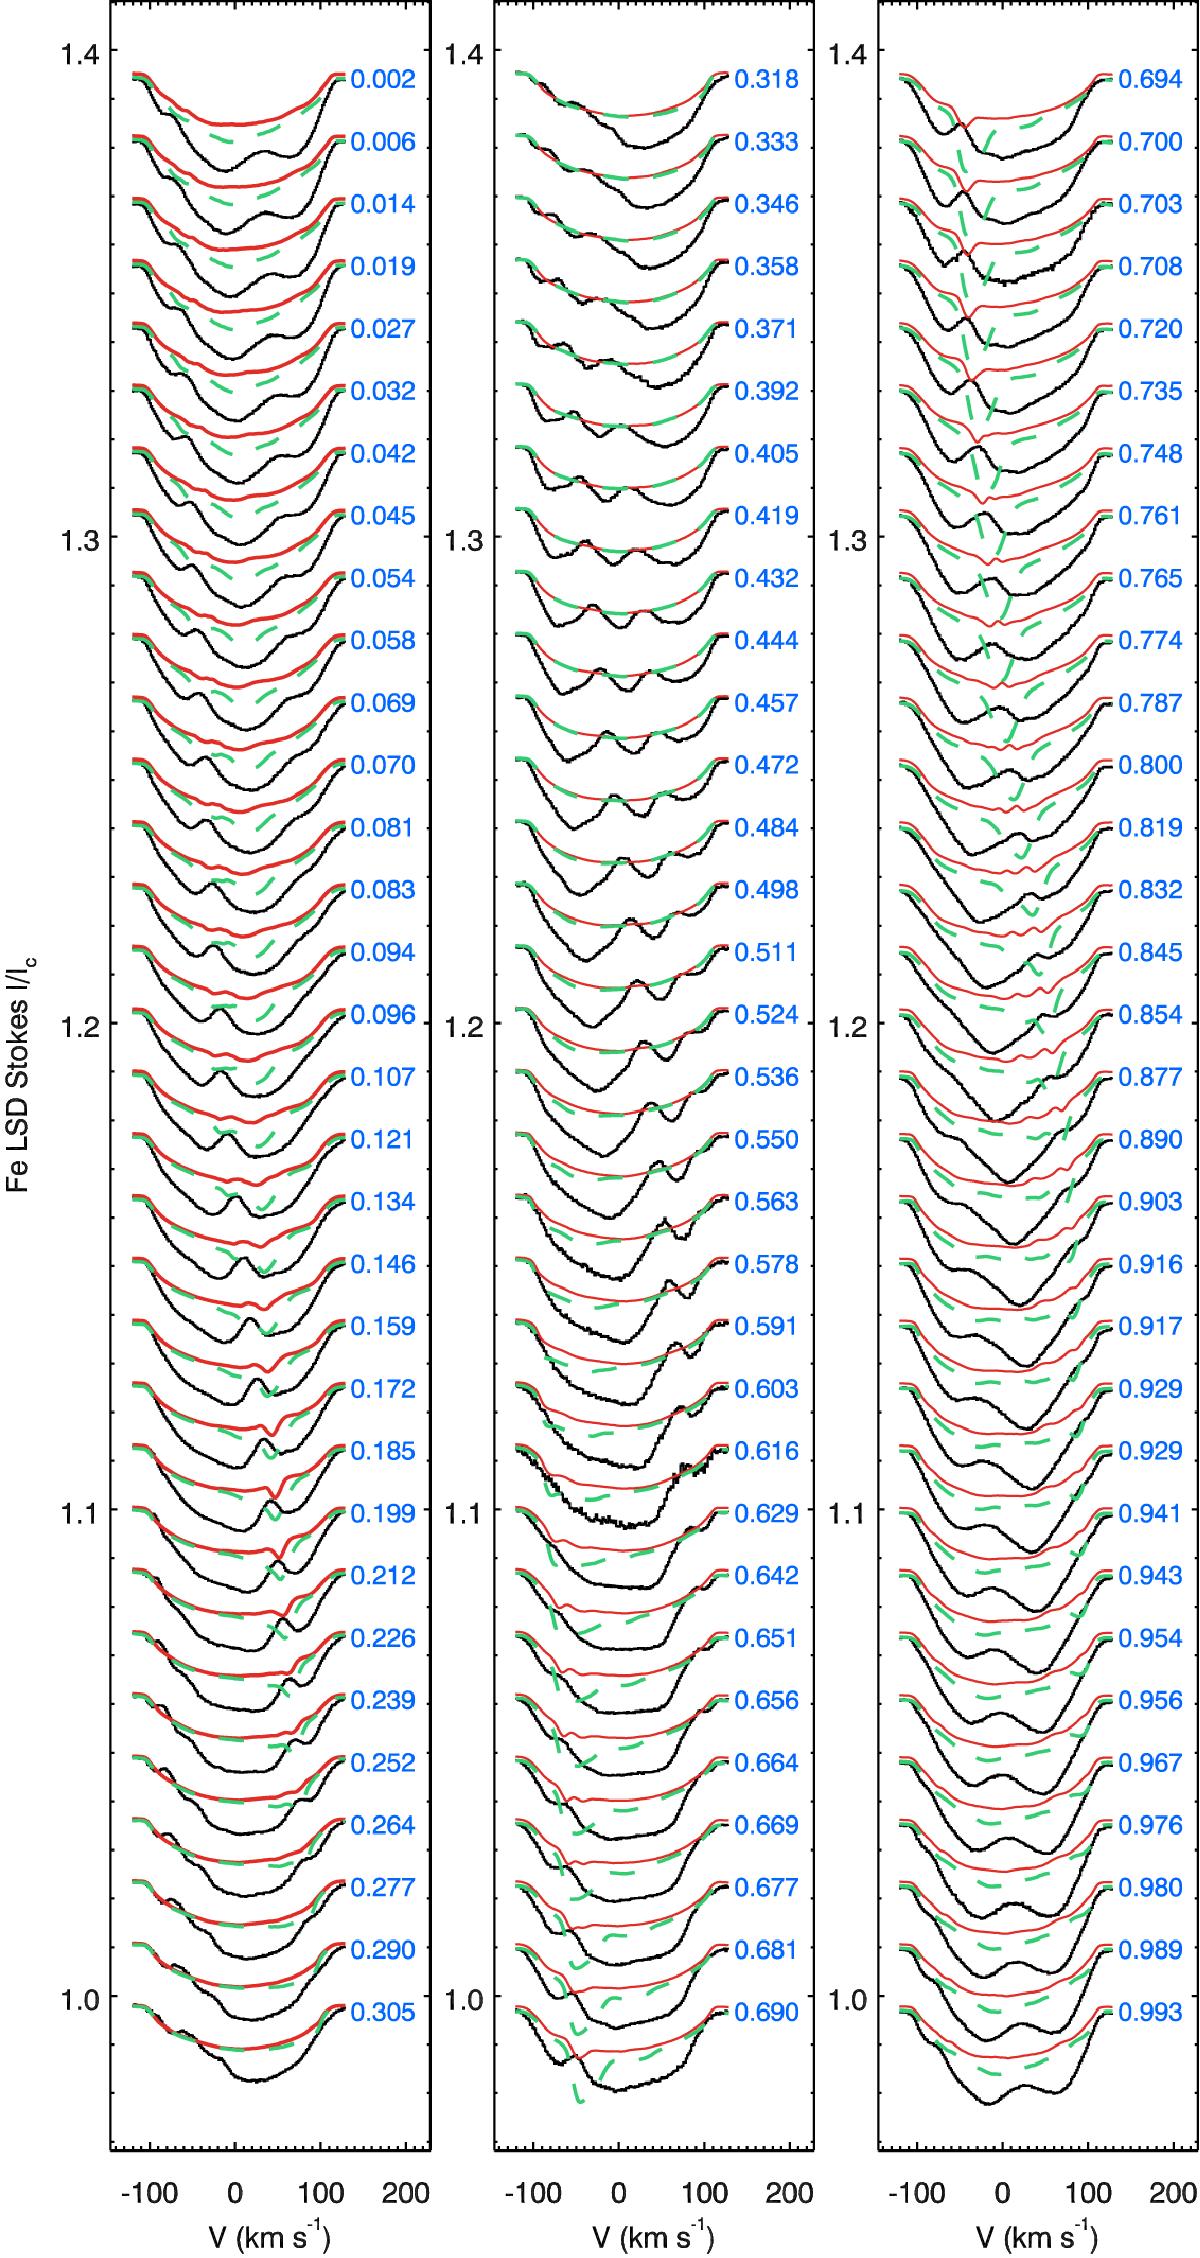
Comparison of the observed Fe LSD Stokes I profiles (black histogram) with calculations according to the diffusion theory predictions. The red solid lines show theoretical profiles for the iron distribution with log NFe/Ntot = −2.0 in the regions with the local field inclination ≥75° and log NFe/Ntot = −3.5 elsewhere. The green dashed lines correspond to similar calculation with log NFe/Ntot = −2.0 adopted for the surface regions with the field inclination ≥45°. Spectra corresponding to different rotation phases are offset vertically. Rotation phases are indicated to the right of each spectrum.
Current usage metrics show cumulative count of Article Views (full-text article views including HTML views, PDF and ePub downloads, according to the available data) and Abstracts Views on Vision4Press platform.
Data correspond to usage on the plateform after 2015. The current usage metrics is available 48-96 hours after online publication and is updated daily on week days.
Initial download of the metrics may take a while.