Free Access
Fig. 17
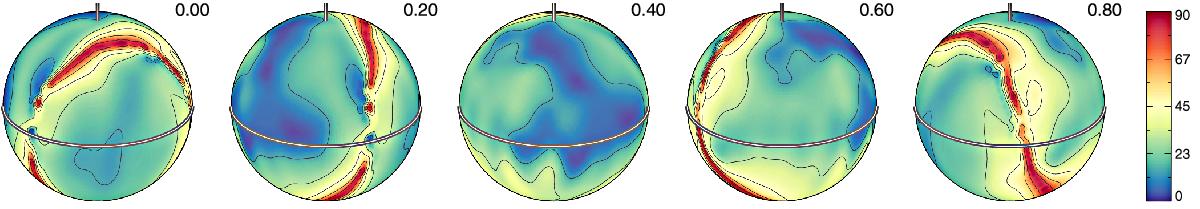
Angle between the local field vector and the surface normal corresponding to the magnetic field maps reconstructed from the Fe LSD profiles (see Fig. 11). The contours over spherical maps are plotted with a step of 15°.
Current usage metrics show cumulative count of Article Views (full-text article views including HTML views, PDF and ePub downloads, according to the available data) and Abstracts Views on Vision4Press platform.
Data correspond to usage on the plateform after 2015. The current usage metrics is available 48-96 hours after online publication and is updated daily on week days.
Initial download of the metrics may take a while.