Free Access
Fig. 1
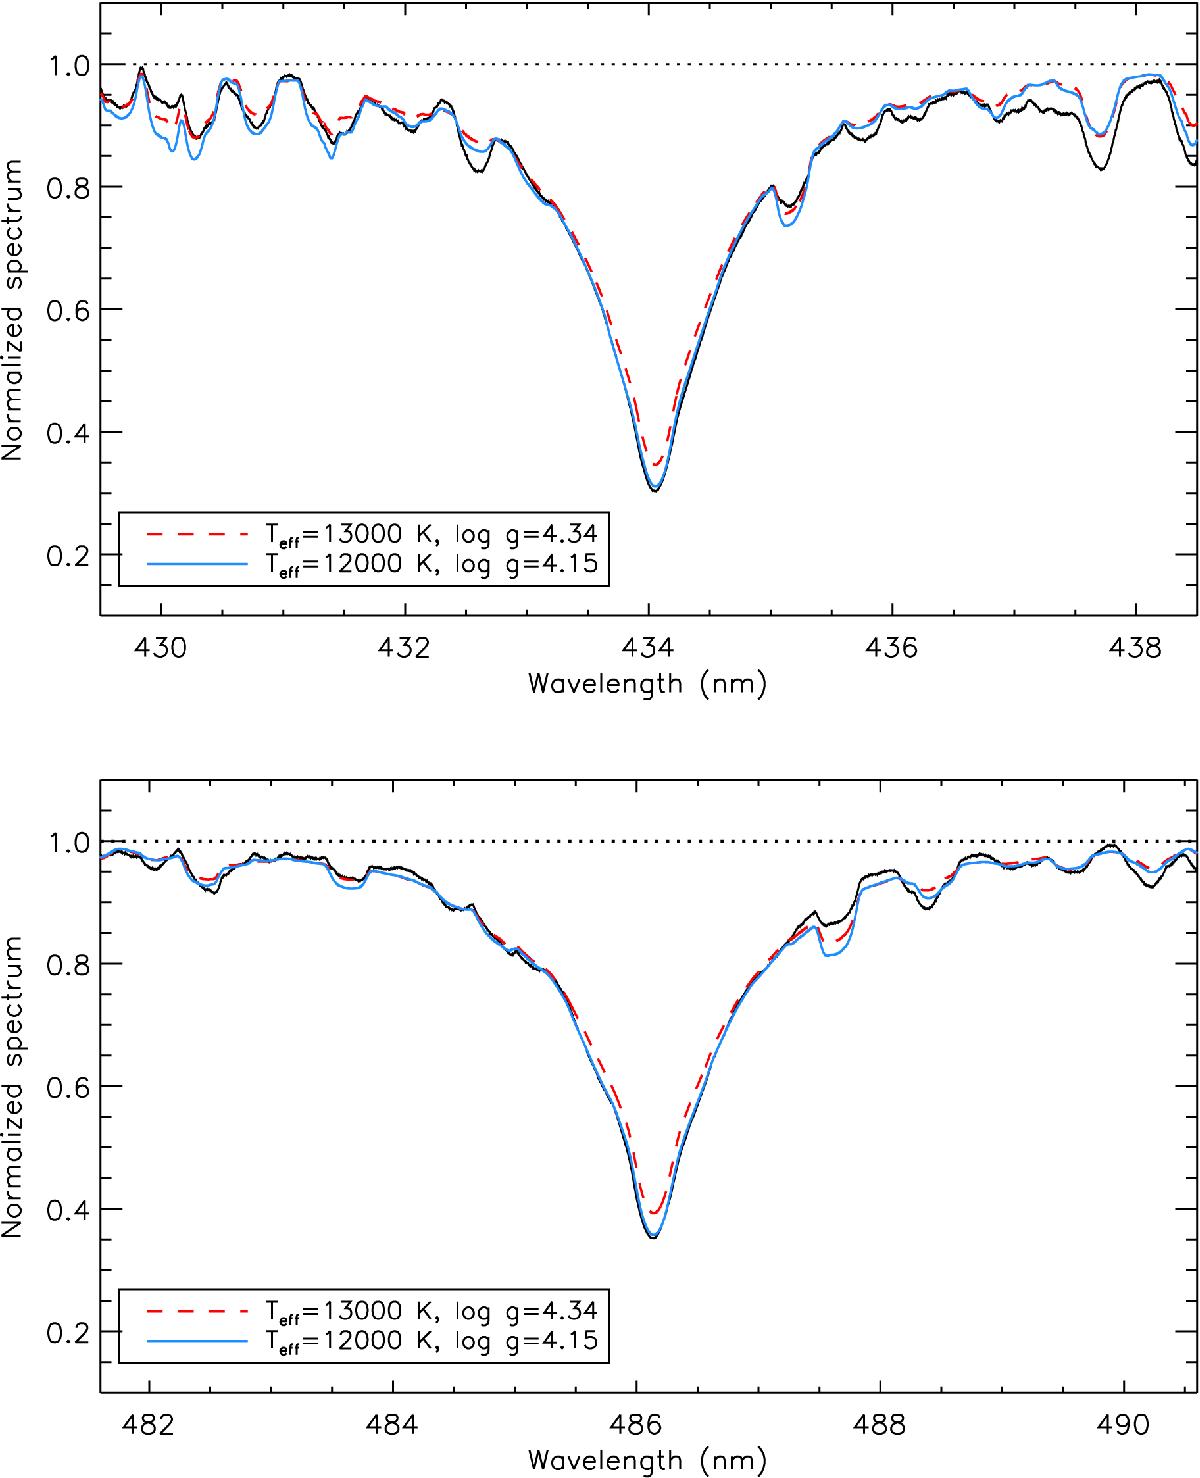
Comparison of the mean observed hydrogen Hγ and Hβ profiles (black histograms) with the synthetic spectra calculated for Teff = 13 000 K, log g = 4.34 (dashed red line) and Teff = 12 000 K, log g = 4.15 (solid blue line).
Current usage metrics show cumulative count of Article Views (full-text article views including HTML views, PDF and ePub downloads, according to the available data) and Abstracts Views on Vision4Press platform.
Data correspond to usage on the plateform after 2015. The current usage metrics is available 48-96 hours after online publication and is updated daily on week days.
Initial download of the metrics may take a while.