Press Release
Free Access
Fig. 5
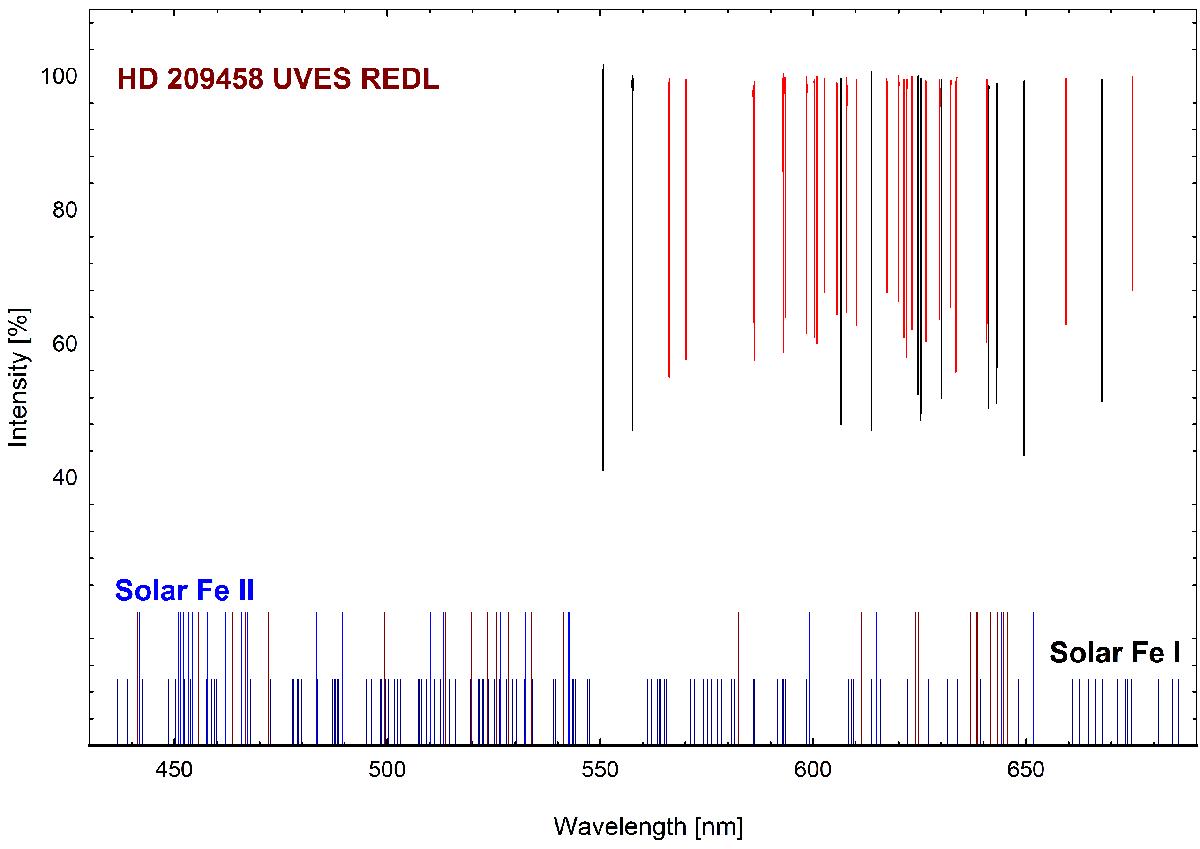
Bottom: wavelengths for candidate unblended Fe I and Fe II lines in the solar spectrum. Top: corresponding lines selected in HD 209458 with observed line depths marked in units of the spectral continuum. The subgroup of finally selected 26 weaker lines is plotted in red and the 11 stronger lines are indicated in blue.
Current usage metrics show cumulative count of Article Views (full-text article views including HTML views, PDF and ePub downloads, according to the available data) and Abstracts Views on Vision4Press platform.
Data correspond to usage on the plateform after 2015. The current usage metrics is available 48-96 hours after online publication and is updated daily on week days.
Initial download of the metrics may take a while.