Press Release
Free Access
Fig. 14
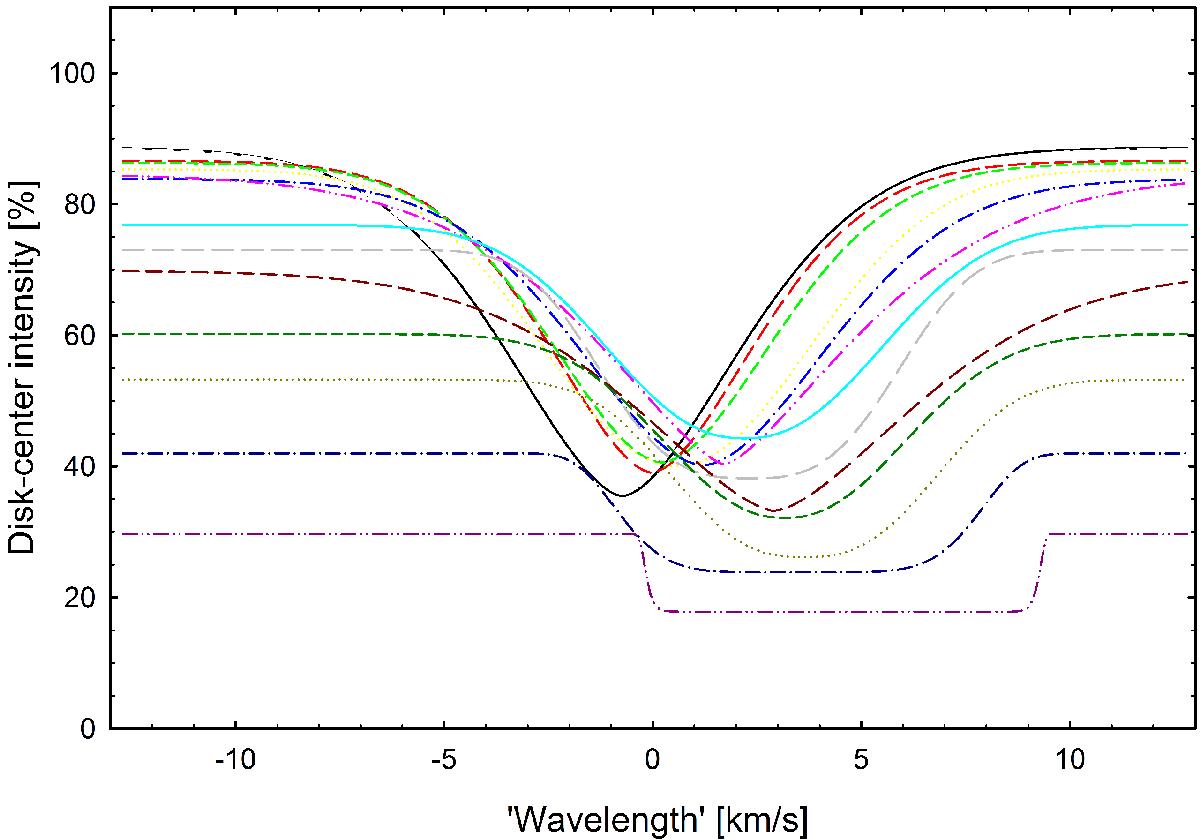
Fitted line profiles at 14 observed epochs during exoplanet transit. The intensity scale is here normalized to stellar disk center, thus also showing the limb darkening at the successive planet positions. Data very close to the limb suggest quite broad profiles, although these measurements are somewhat uncertain.
Current usage metrics show cumulative count of Article Views (full-text article views including HTML views, PDF and ePub downloads, according to the available data) and Abstracts Views on Vision4Press platform.
Data correspond to usage on the plateform after 2015. The current usage metrics is available 48-96 hours after online publication and is updated daily on week days.
Initial download of the metrics may take a while.