Free Access
Fig. 6
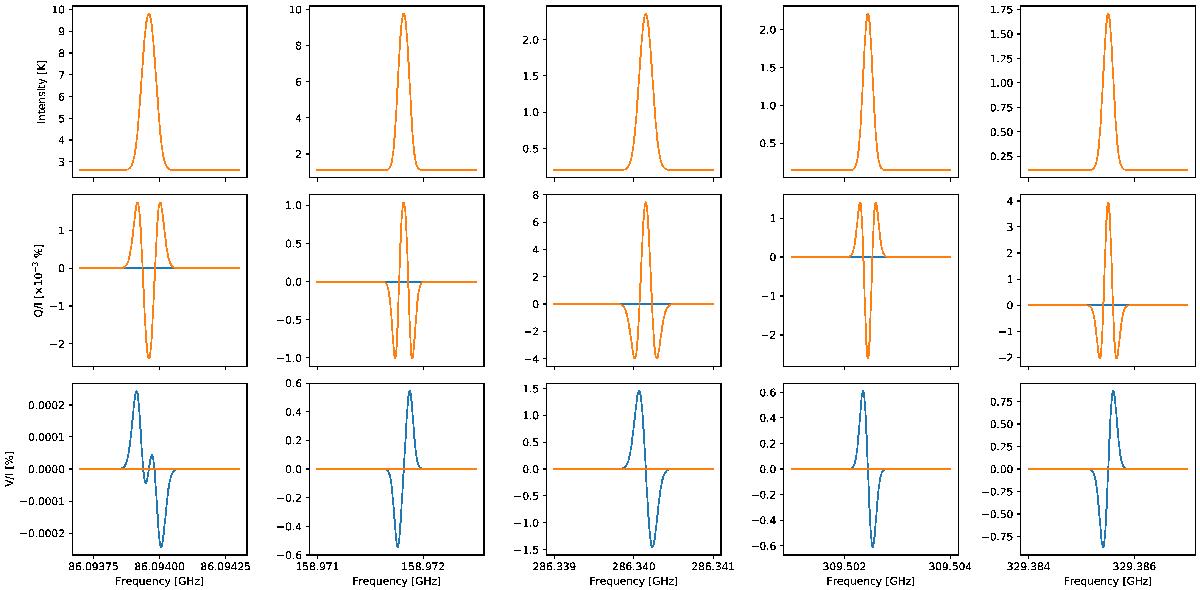
Synthetic intensity in temperature units (upper row), Stokes Q/I (middle row) and V/I (lower row) for five of the most SO representative lines in a cloud model. Blue curves display the results for a field pointing to the observer, while orange shows fields pointing perpendicular to the observer.
Current usage metrics show cumulative count of Article Views (full-text article views including HTML views, PDF and ePub downloads, according to the available data) and Abstracts Views on Vision4Press platform.
Data correspond to usage on the plateform after 2015. The current usage metrics is available 48-96 hours after online publication and is updated daily on week days.
Initial download of the metrics may take a while.