Fig. 7
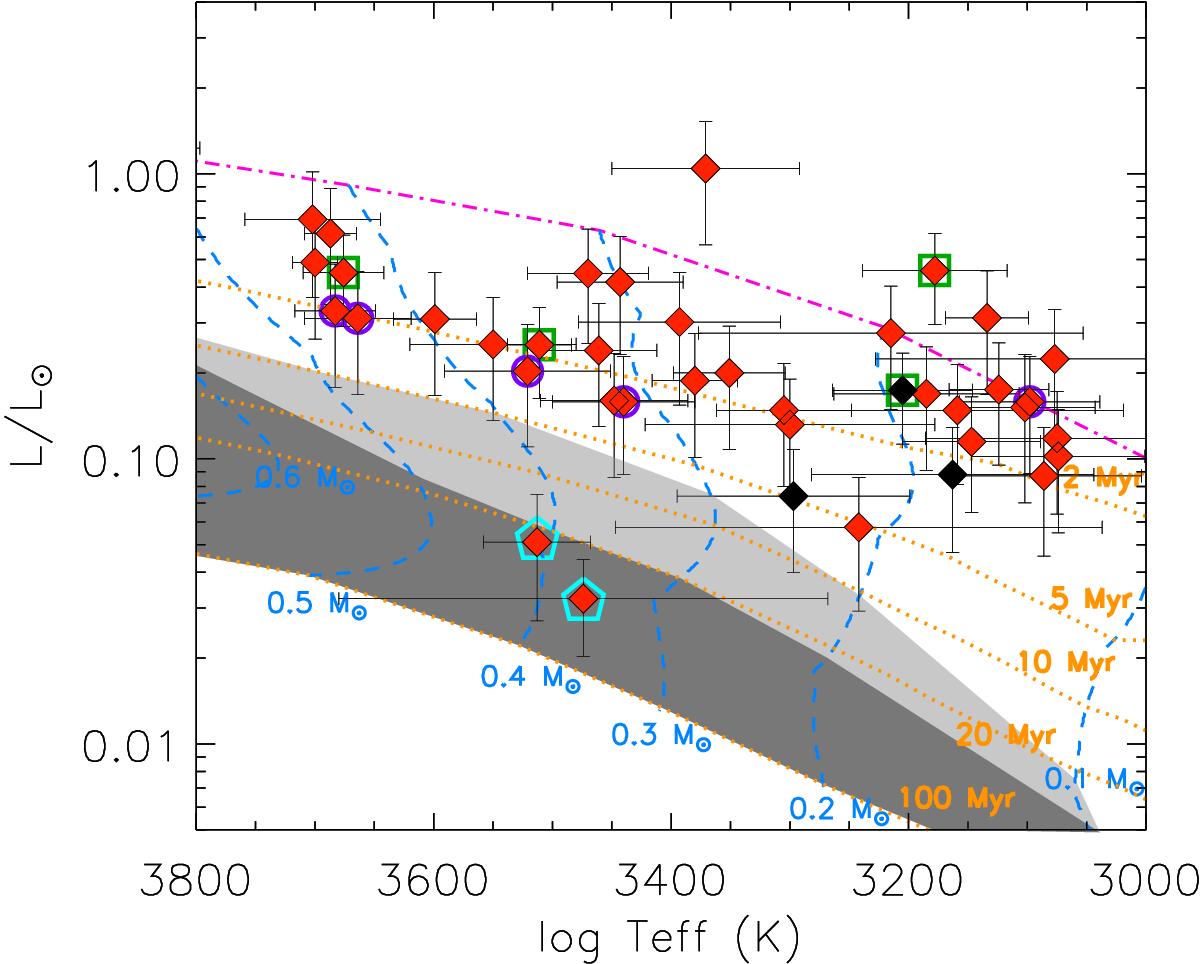
Hertzsprung-Russell diagram for the sample stars with masses ~ 0.2−0.5 M⊙. The shaded regions indicate different levels of predicted Li depletion: up to a factor of 10 (light gray) and more (dark gray) below the initial value and according to the models of Baraffe et al. (2015). Masses from evolutionary tracks and isochronal ages from Baraffe et al. (2015) are labeled. The birth line is shown with a dash-dotted line. Black diamonds refer to targets showing depletion (i.e., Sz 99, Sz 69, and Sz 94; see text and Fig. 8). Open squares, circles, and pentagons represent the position of the class III, transitional disk, and sub-luminous or flat targets, respectively.
Current usage metrics show cumulative count of Article Views (full-text article views including HTML views, PDF and ePub downloads, according to the available data) and Abstracts Views on Vision4Press platform.
Data correspond to usage on the plateform after 2015. The current usage metrics is available 48-96 hours after online publication and is updated daily on week days.
Initial download of the metrics may take a while.