Fig. 2
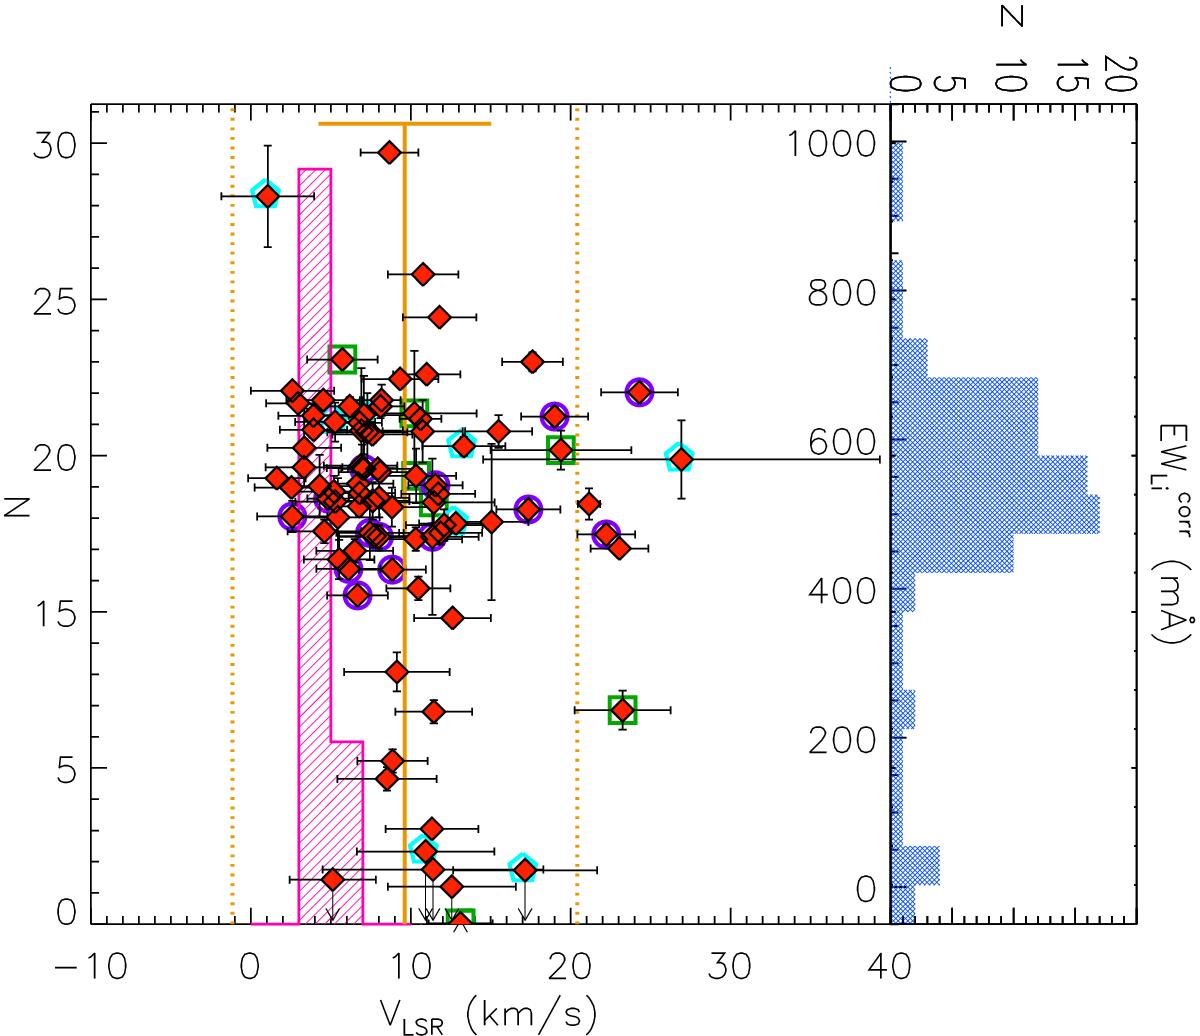
Corrected lithium equivalent width versus radial velocity (from Frasca et al. 2017) in the LSR. Different symbols are used for class III (open green squares), transitional disk (violet circles), and sub-luminous or flat spectral energy distribution objects (cyano pentagons), as defined in Alcalá et al. (2017). The vertical solid line indicates the mean VLSR (9.6 ± 5.4 km s-1) of our targets, while the dotted ones represent the ⟨ VLSR ⟩±2σ values. Upper limits are marked by arrows. The magenta hatched histogram in the background of the left panel represents the velocity distribution of gas condensations in Lupus as derived by Vilas-Boas et al. (2000). The histogram on the right panel shows our EWLi distribution, with a peak around ~ 560 mÅ.
Current usage metrics show cumulative count of Article Views (full-text article views including HTML views, PDF and ePub downloads, according to the available data) and Abstracts Views on Vision4Press platform.
Data correspond to usage on the plateform after 2015. The current usage metrics is available 48-96 hours after online publication and is updated daily on week days.
Initial download of the metrics may take a while.