Fig. 10
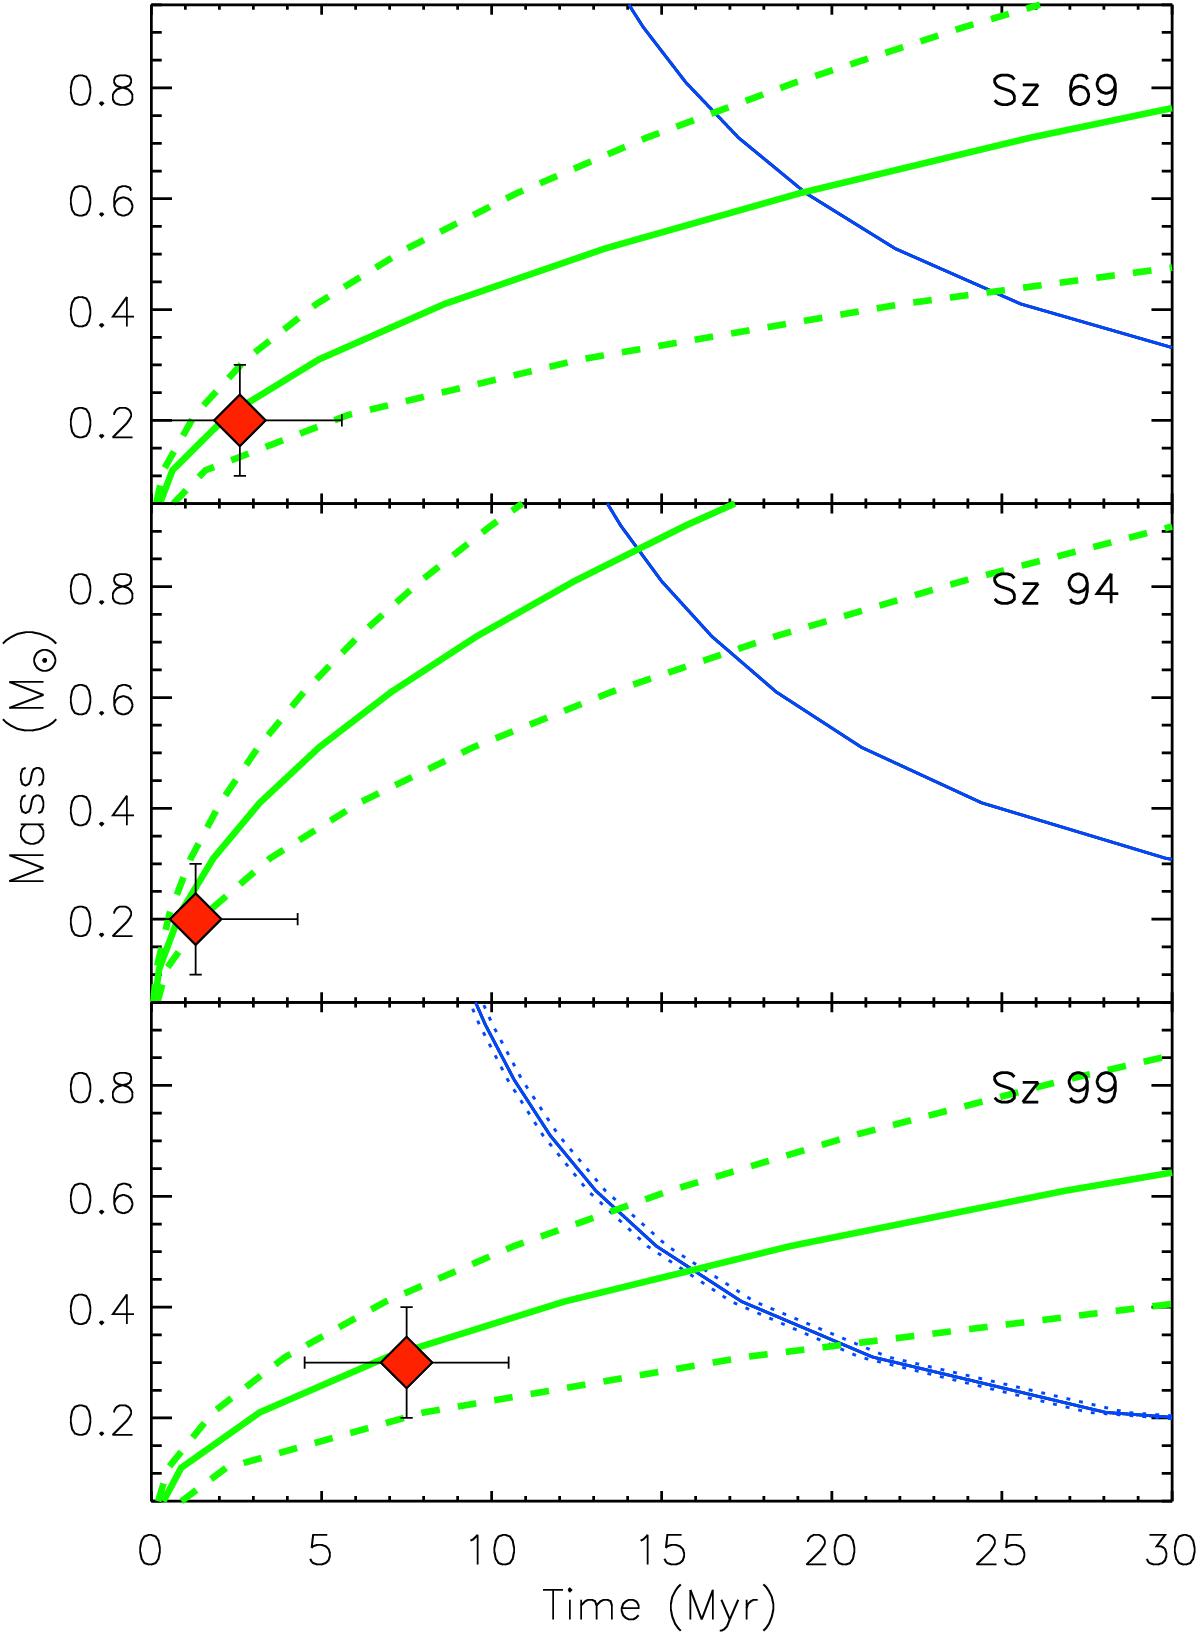
Mass versus age for the three stars with evidence of Li depletion. The curves at a given luminosity (solid green line with positive slope) and at a given lithium abundance (solid blue line with negative slope) were computed for the values of Teff, luminosity, and lithium depletion given in Table 2. The dashed and dotted curves represent the uncertainty ranges in the observed luminosity and in the measured abundance, respectively. They define the locus where the values of mass and time are consistent with the observations. For Sz 69 and Sz 94 no errors in Li abundances are reported because their values, consistent with zero, are upper limits. The diamonds give the mass and age from theoretical PMS tracks and isochrones, with typical errors of ~ 0.1 M⊙ and ~ 3 Myr, respectively (see Frasca et al. 2017).
Current usage metrics show cumulative count of Article Views (full-text article views including HTML views, PDF and ePub downloads, according to the available data) and Abstracts Views on Vision4Press platform.
Data correspond to usage on the plateform after 2015. The current usage metrics is available 48-96 hours after online publication and is updated daily on week days.
Initial download of the metrics may take a while.