Fig. 1
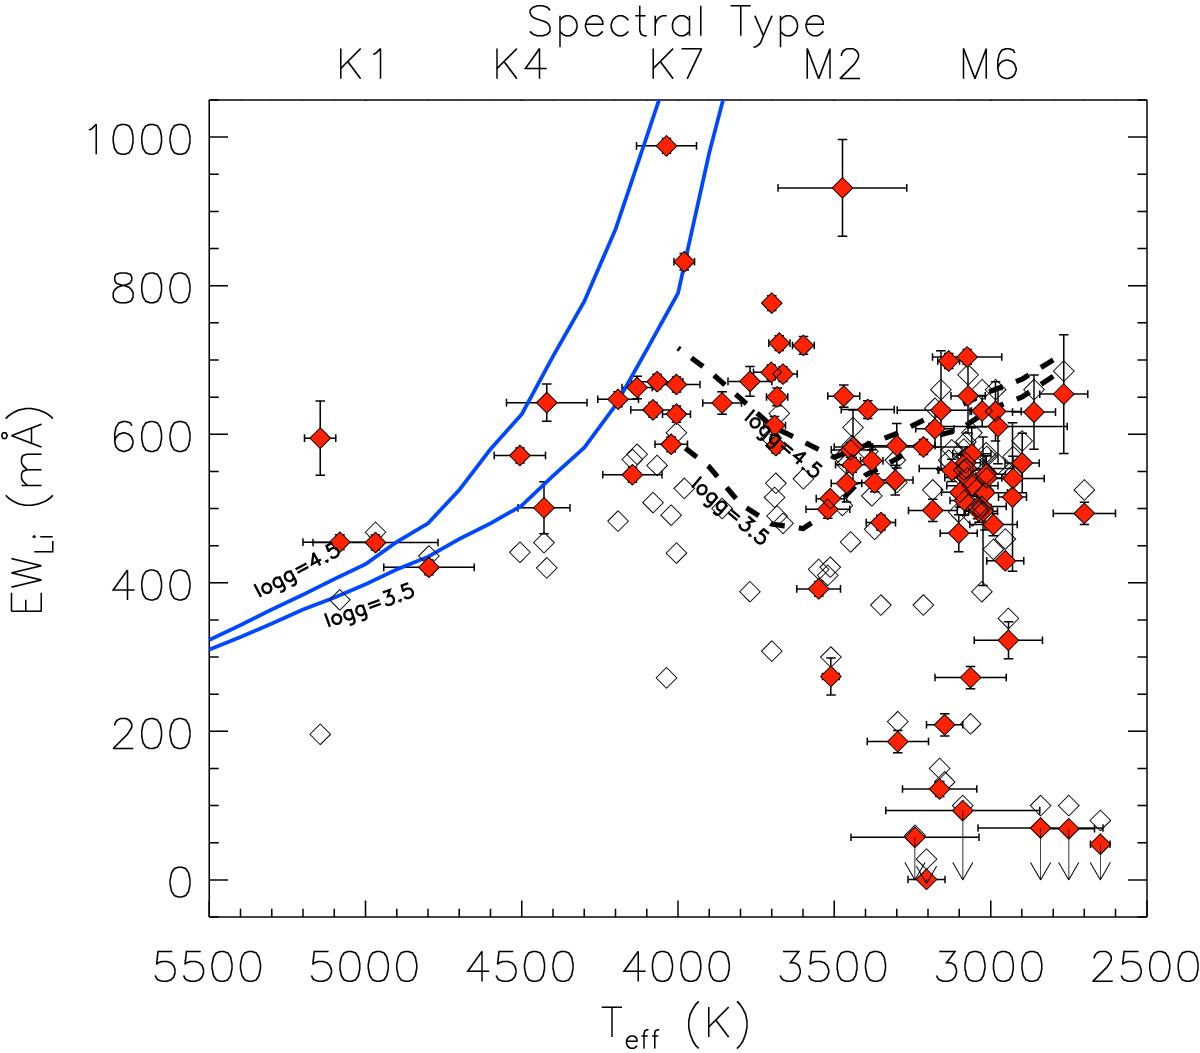
Lithium equivalent width versus effective temperature for the studied sample. Open symbols refer to measured EWLi, while filled red symbols represent the lithium equivalent widths after correction for blending with the iron line and spectral veiling. Overplotted as black dashed and blue solid lines are the COGs at log g = 3.5,4.5 and lithium abundance of 3.5 dex from Palla et al. (2007) and Pavlenko & Magazzù (1996), respectively. Arrows indicate upper limits (see text). Spectral types as in Luhman et al. (2003) for M-type young stellar objects (YSOs) and Kenyon & Hartmann (1995) for K-type YSOs are marked above the plot (see also Alcalá et al. 2017 and Table A.1).
Current usage metrics show cumulative count of Article Views (full-text article views including HTML views, PDF and ePub downloads, according to the available data) and Abstracts Views on Vision4Press platform.
Data correspond to usage on the plateform after 2015. The current usage metrics is available 48-96 hours after online publication and is updated daily on week days.
Initial download of the metrics may take a while.