Fig. 1
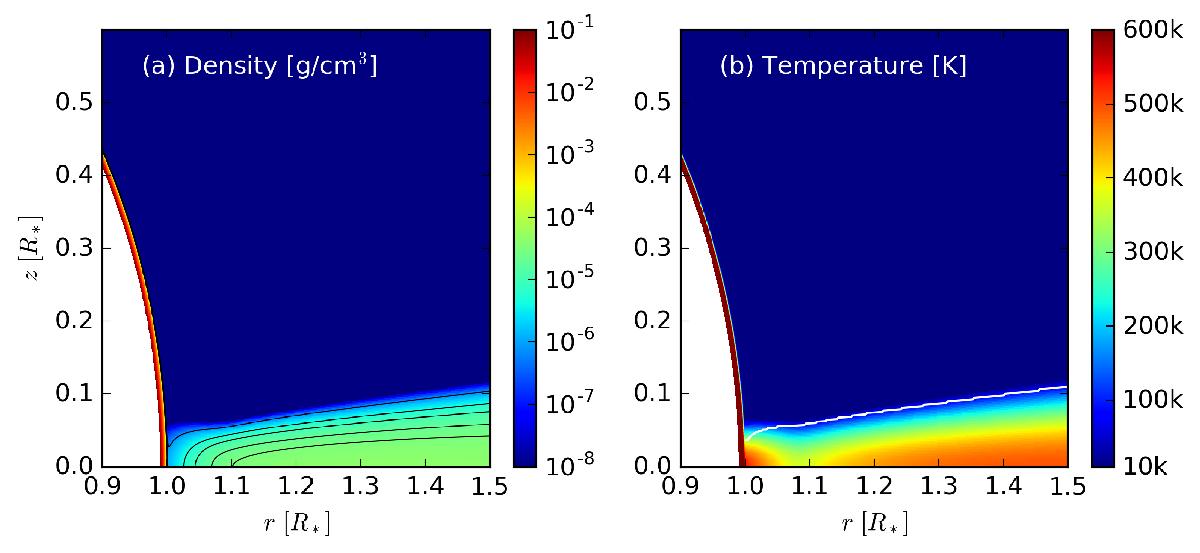
Density (a) and temperature (b) for the reference model as a function of radius r and vertical coordinate z in cgs units at orbit 688. Contour lines for the levels (0.8,5,10,20,30) × 10-6 g / cm3 are overlaid in the plot of the density a). The white line in panel b denotes the points where the optical depth is unity, τ = 1.
Current usage metrics show cumulative count of Article Views (full-text article views including HTML views, PDF and ePub downloads, according to the available data) and Abstracts Views on Vision4Press platform.
Data correspond to usage on the plateform after 2015. The current usage metrics is available 48-96 hours after online publication and is updated daily on week days.
Initial download of the metrics may take a while.