Fig. 8
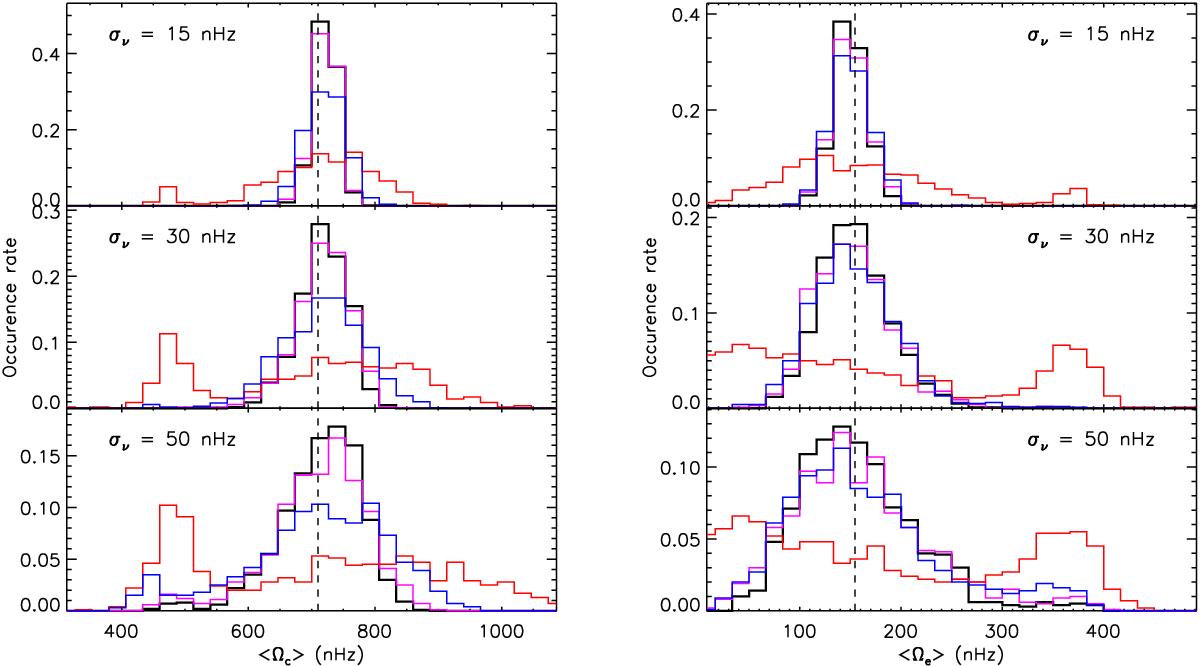
Distribution of the values of ⟨ Ω ⟩ c (left) and ⟨ Ω ⟩ e (right) obtained by fitting Eq. (24) to the mode frequencies of acor for model D, assuming a rotation profile with ⟨ Ω ⟩ c/ 2π = 710 nHz and ⟨ Ω ⟩ c/ ⟨ Ω ⟩ e = 5. A random noise with an rms of 15 nHz (top), 30 nHz (middle), and 50 nHz (bottom) was added to the mode frequencies. The colors correspond to the different scenarios that were tested: ideal case where all the components are detected (black), inclination angle of 90° (purple) or 30° (red), and case of an overlap with the closest radial mode (blue). The vertical dashed lines indicate the actual values of ⟨ Ω ⟩ c and ⟨ Ω ⟩ e computed with Eqs. (19) and (20).
Current usage metrics show cumulative count of Article Views (full-text article views including HTML views, PDF and ePub downloads, according to the available data) and Abstracts Views on Vision4Press platform.
Data correspond to usage on the plateform after 2015. The current usage metrics is available 48-96 hours after online publication and is updated daily on week days.
Initial download of the metrics may take a while.