Fig. 8
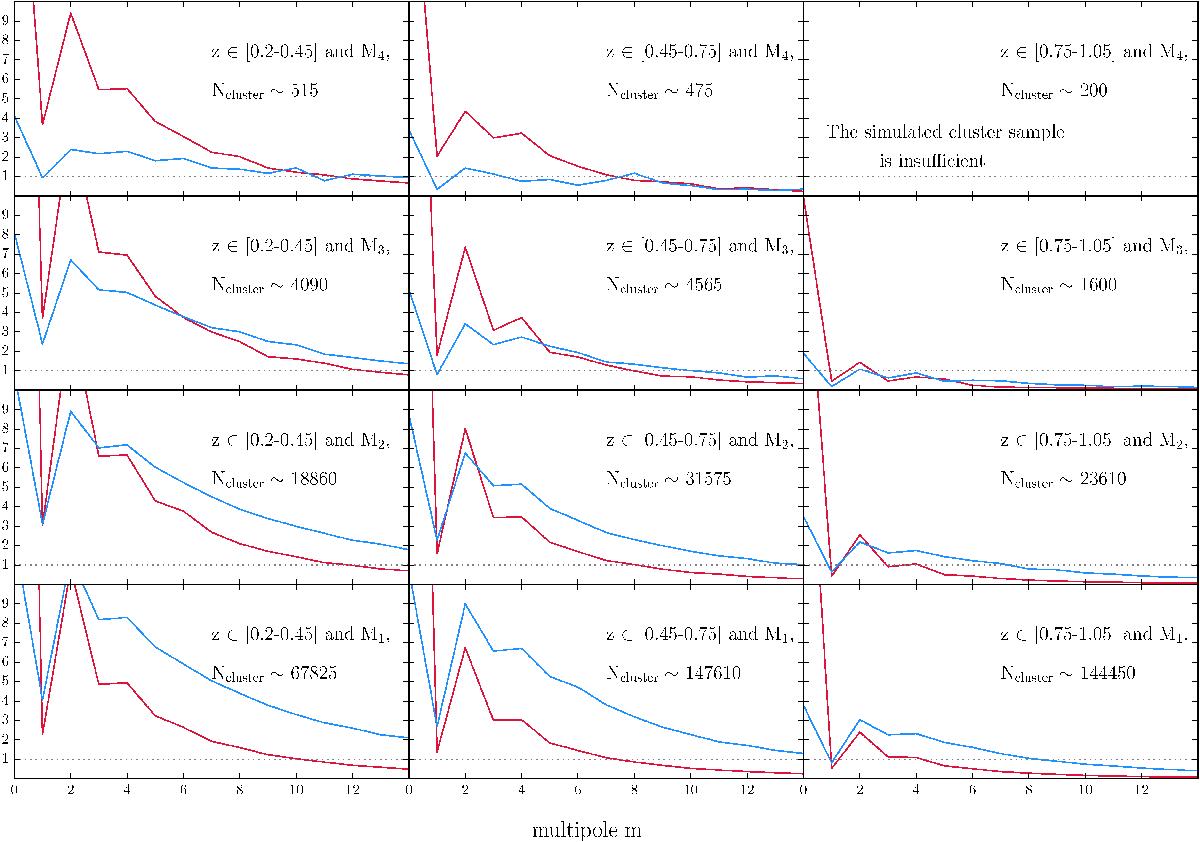
Expected signal-to-noise ratio of multipolar moment spectra that one could obtain by stacking the total number of galaxy clusters Ncluster(z,M), that will be uncovered in the future Euclid survey (Sartoris et al. 2016). Red and blue curves represent the signal-to-noise ratio for the annuli R1 ∈ [ 0.25 − 0.5 ] Rvir and R4 ∈ [ 1 − 4 ] Rvir, respectively. Three different ranges of redshift are considered (~ 0.3, ~ 0.6 and ~ 0.9 from left to right), together with four fiducial cluster mass intervals (M4,···M1, from top to bottom).
Current usage metrics show cumulative count of Article Views (full-text article views including HTML views, PDF and ePub downloads, according to the available data) and Abstracts Views on Vision4Press platform.
Data correspond to usage on the plateform after 2015. The current usage metrics is available 48-96 hours after online publication and is updated daily on week days.
Initial download of the metrics may take a while.