Fig. 7
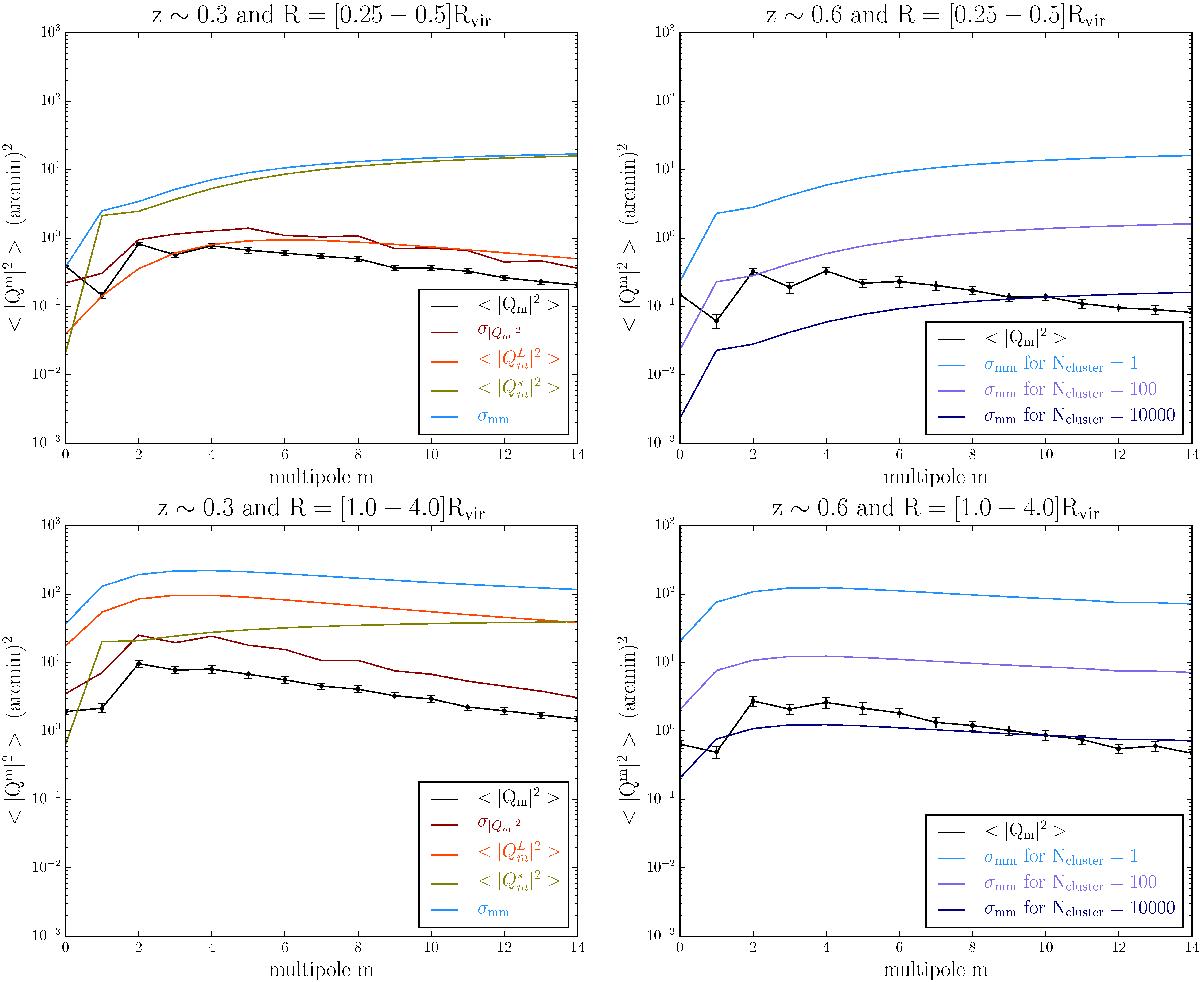
Multipolar moment spectra of clusters for the mass bin M3 and the noise contribution at two scales in the annuli ΔR1 (top panel) and ΔR4 (bottom panel) and for two redshift values z = 0.3 and 0.6, respectively, from left to right. The left-hand panels show the different sources of noise as described in Sect. 4. On the right-hand panels, the total noise profile σmm is shown once divided by ![]() in order to mimic the shot noise obtained by stacking the spectra of Nclusters clusters.
in order to mimic the shot noise obtained by stacking the spectra of Nclusters clusters.
Current usage metrics show cumulative count of Article Views (full-text article views including HTML views, PDF and ePub downloads, according to the available data) and Abstracts Views on Vision4Press platform.
Data correspond to usage on the plateform after 2015. The current usage metrics is available 48-96 hours after online publication and is updated daily on week days.
Initial download of the metrics may take a while.