Fig. 4
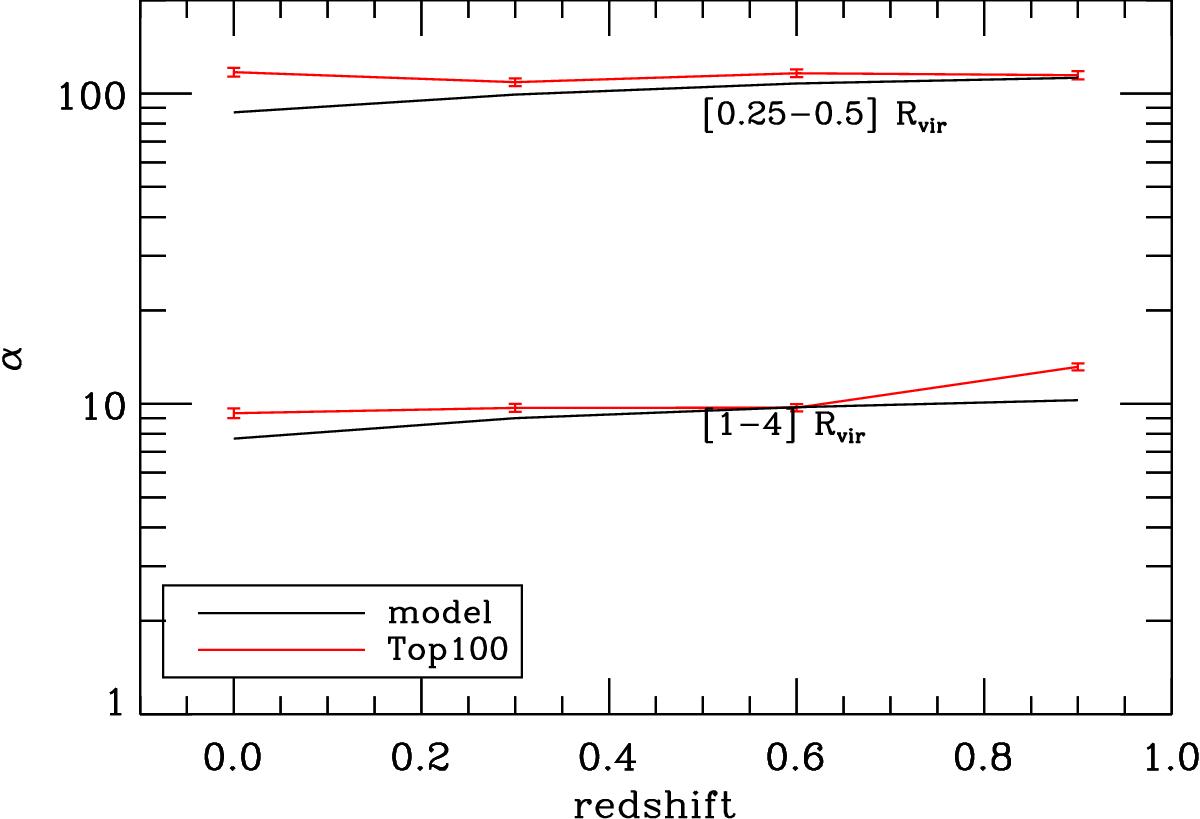
Evolution with redshift of the normalisation factor ![]() of multipolar moments spectra for the 100 most massive haloes (red solid lines). The theoretical prediction of α is overlaid in black. The model reproduces the variations with time, mass and scale remarkably well, despite a crude treatment of projections and the limited validity of the spherical collapse model.
of multipolar moments spectra for the 100 most massive haloes (red solid lines). The theoretical prediction of α is overlaid in black. The model reproduces the variations with time, mass and scale remarkably well, despite a crude treatment of projections and the limited validity of the spherical collapse model.
Current usage metrics show cumulative count of Article Views (full-text article views including HTML views, PDF and ePub downloads, according to the available data) and Abstracts Views on Vision4Press platform.
Data correspond to usage on the plateform after 2015. The current usage metrics is available 48-96 hours after online publication and is updated daily on week days.
Initial download of the metrics may take a while.