Fig. 3
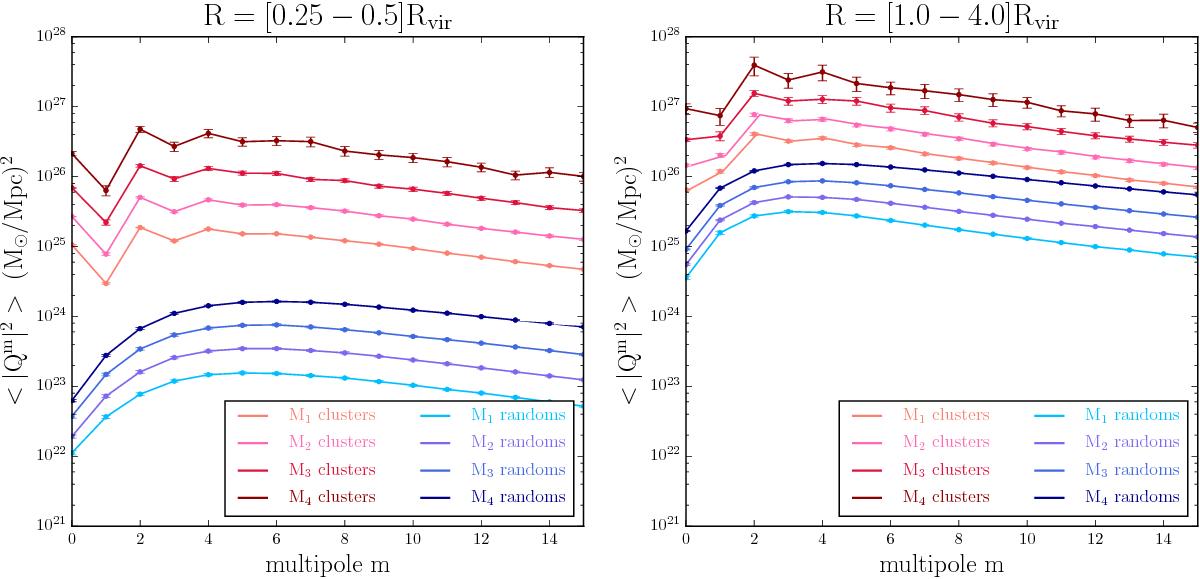
Multipolar moments spectra around clusters (upper red curves) and around random location (lower blue curves) for the two annuli 0.25 ≤ R/Rvir< 0.5 and 1 ≤ R/Rvir< 4 (left and right-hand panels respectively) for the z = 0 simulation output. There is an excess of power around clusters as compared to random localisations, since the density field is denser. At large m (substructures scales), their spectra differ by a nearly constant multiplicative factor ![]() , which is the first order signature of the dynamical evolution of the shape of clusters (see Sect. 3.3).
, which is the first order signature of the dynamical evolution of the shape of clusters (see Sect. 3.3).
Current usage metrics show cumulative count of Article Views (full-text article views including HTML views, PDF and ePub downloads, according to the available data) and Abstracts Views on Vision4Press platform.
Data correspond to usage on the plateform after 2015. The current usage metrics is available 48-96 hours after online publication and is updated daily on week days.
Initial download of the metrics may take a while.