Fig. 7
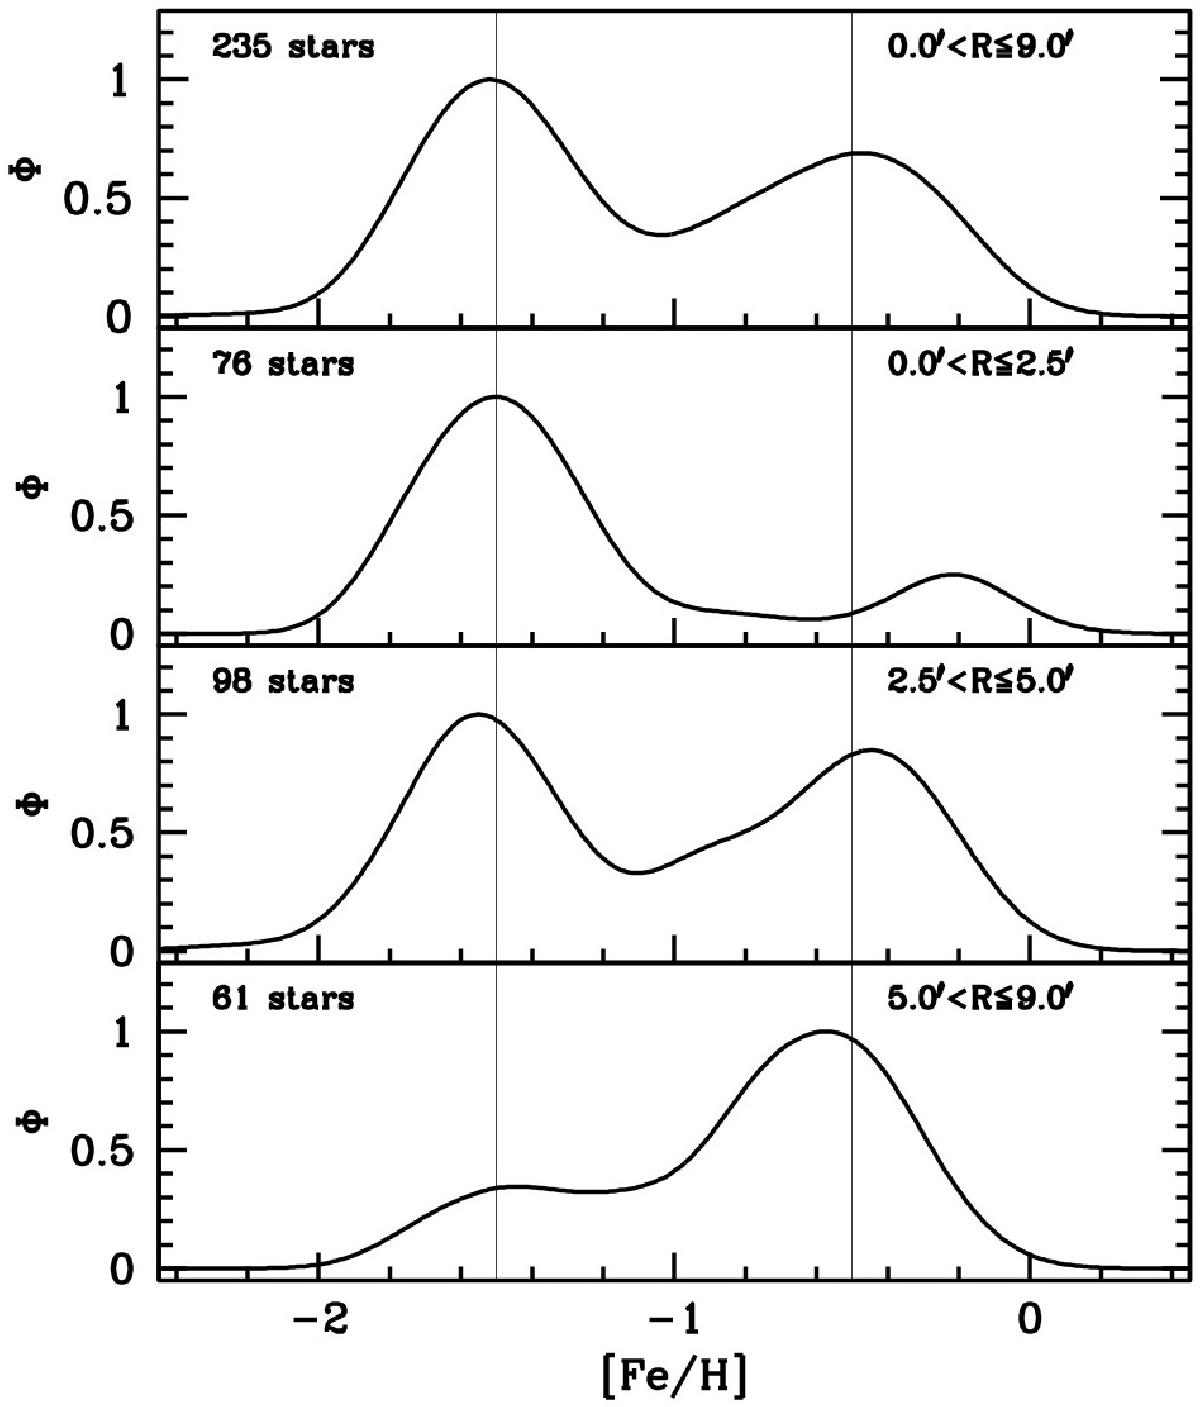
Metallicity distribution of stars in our sample in different radial annuli around the centre of M 54/Sgr, N. The distributions are in the form of generalised histograms normalised at their maximum. The thin vertical lines are for reference and are placed at [Fe/H] =−1.50 and [Fe/H] =−0.5, near the mean of the two peaks, corresponding to M 54 and Sgr, N.
Current usage metrics show cumulative count of Article Views (full-text article views including HTML views, PDF and ePub downloads, according to the available data) and Abstracts Views on Vision4Press platform.
Data correspond to usage on the plateform after 2015. The current usage metrics is available 48-96 hours after online publication and is updated daily on week days.
Initial download of the metrics may take a while.