Fig. 5
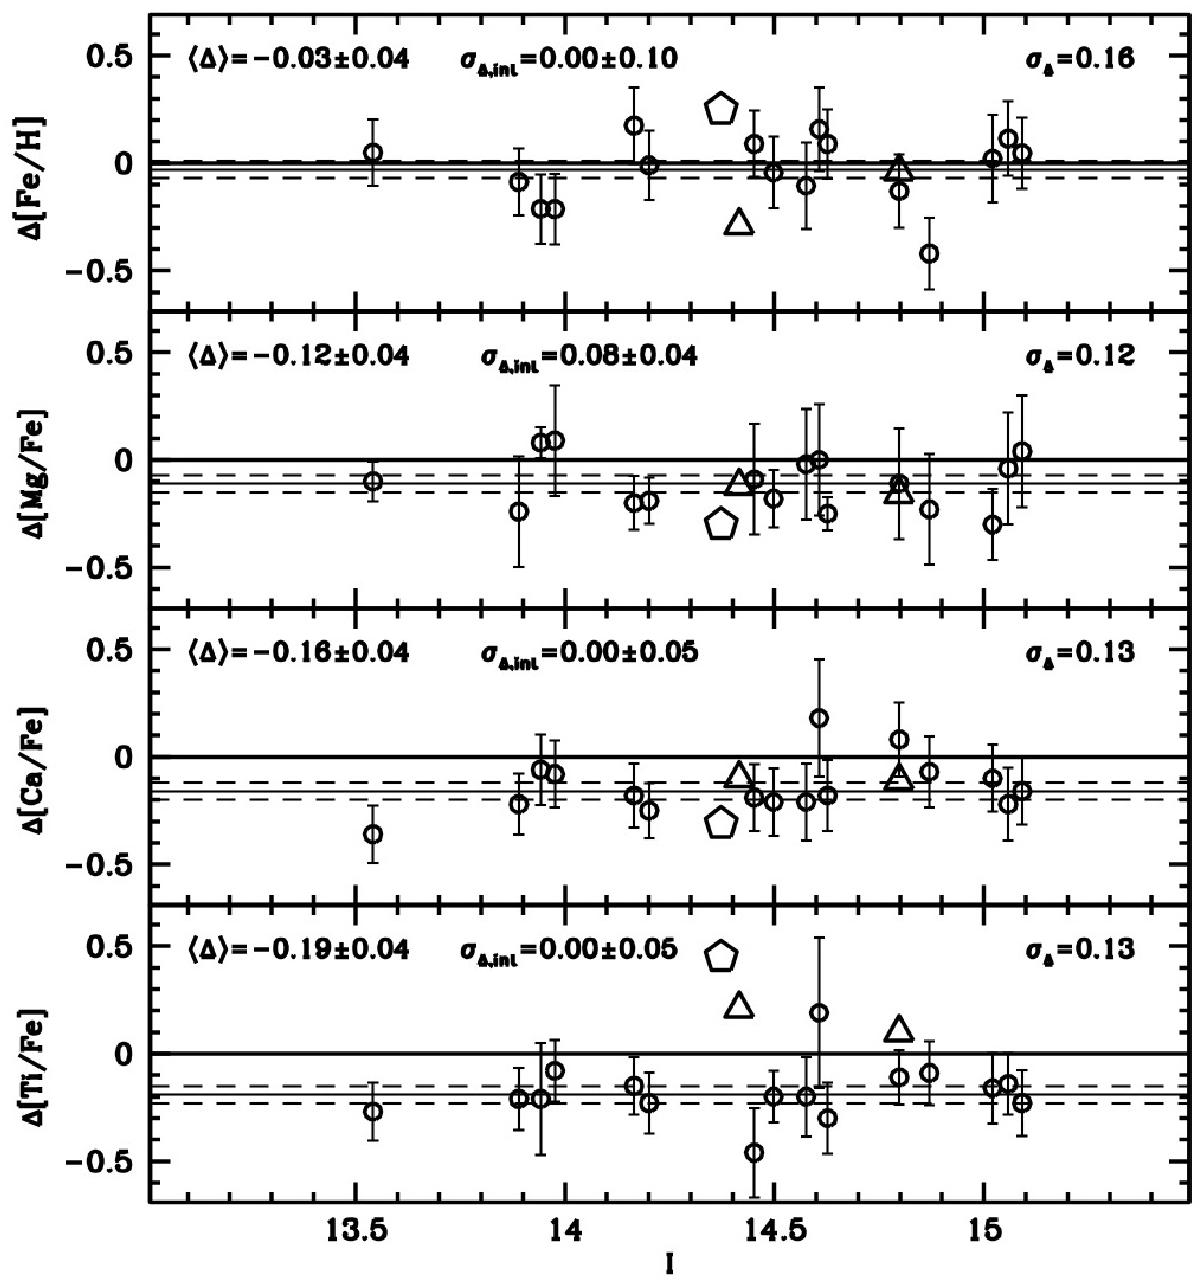
Differences in the abundance of stars in common between this work and other analyses (Δ = other analyses – this work). The small empty circles are from C10b, empty triangles from M05, empty pentagons from MWM13. The thin continuous line is the mean of the differenc with respect to C10b and the thin dashed lines enclose the errors about the mean, as derived with the Maximum Likelihood algorithm (value reported in the upper left corner of each panel, together with the intrinsic dispersion and the associated uncertainties). The value of the straight standard deviation of the difference is also reported in the upper right corner of each panel.
Current usage metrics show cumulative count of Article Views (full-text article views including HTML views, PDF and ePub downloads, according to the available data) and Abstracts Views on Vision4Press platform.
Data correspond to usage on the plateform after 2015. The current usage metrics is available 48-96 hours after online publication and is updated daily on week days.
Initial download of the metrics may take a while.