Free Access
Fig. 3
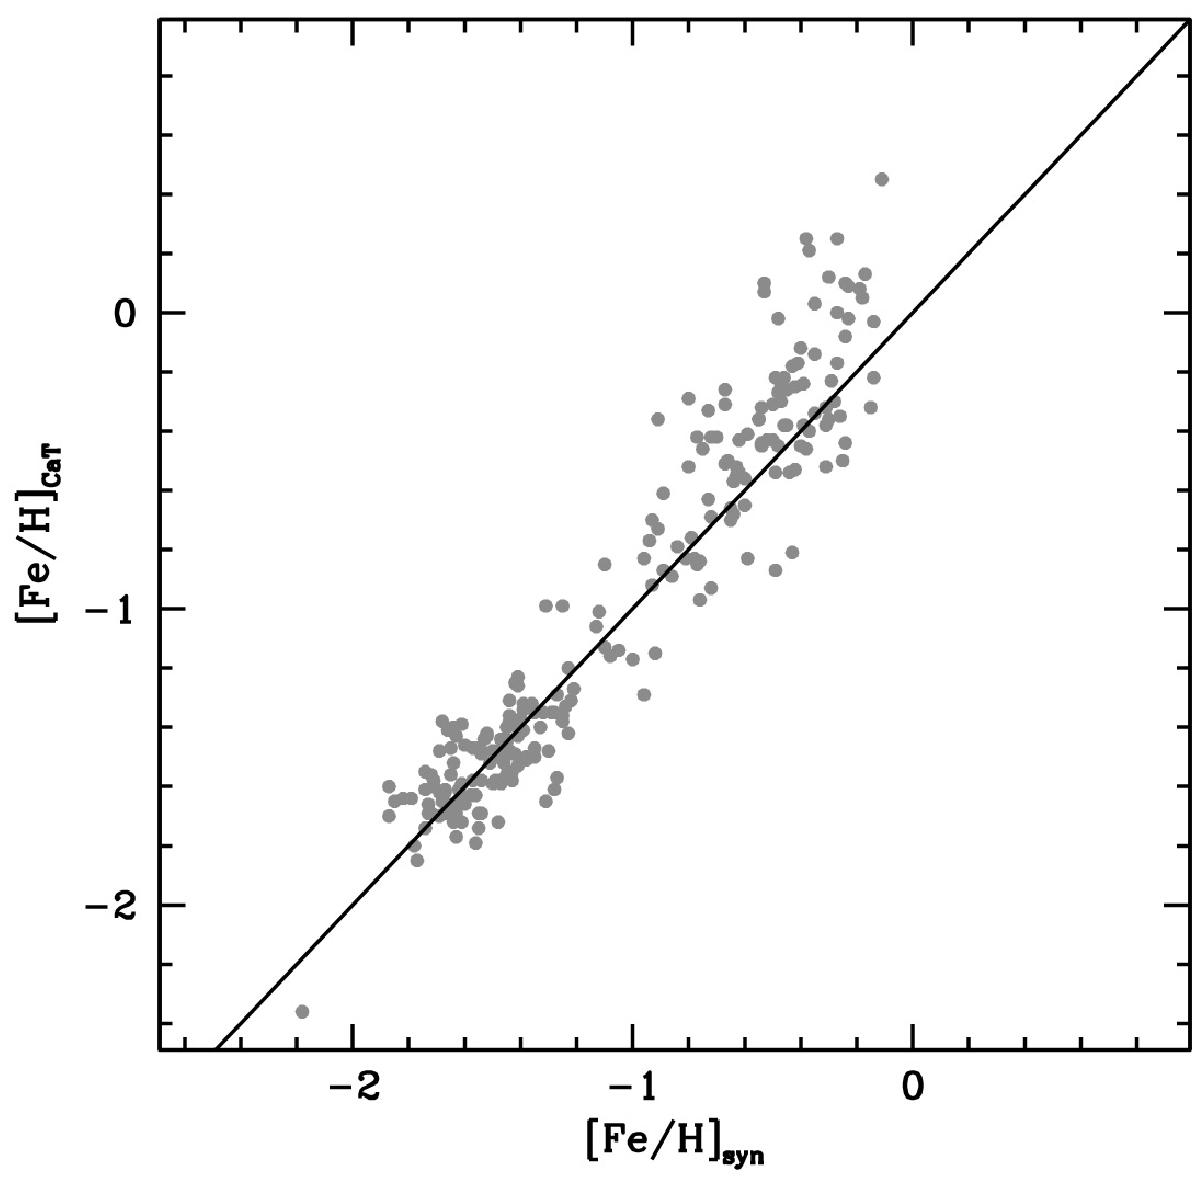
Comparison of iron abundances obtained by spectral synthesis of iron lines in the present analysis and those derived by B08 with the calcium triplet technique, from the same spectra. The diagonal line has slope = 1.0.
Current usage metrics show cumulative count of Article Views (full-text article views including HTML views, PDF and ePub downloads, according to the available data) and Abstracts Views on Vision4Press platform.
Data correspond to usage on the plateform after 2015. The current usage metrics is available 48-96 hours after online publication and is updated daily on week days.
Initial download of the metrics may take a while.