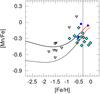
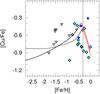
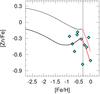
Fig. 13
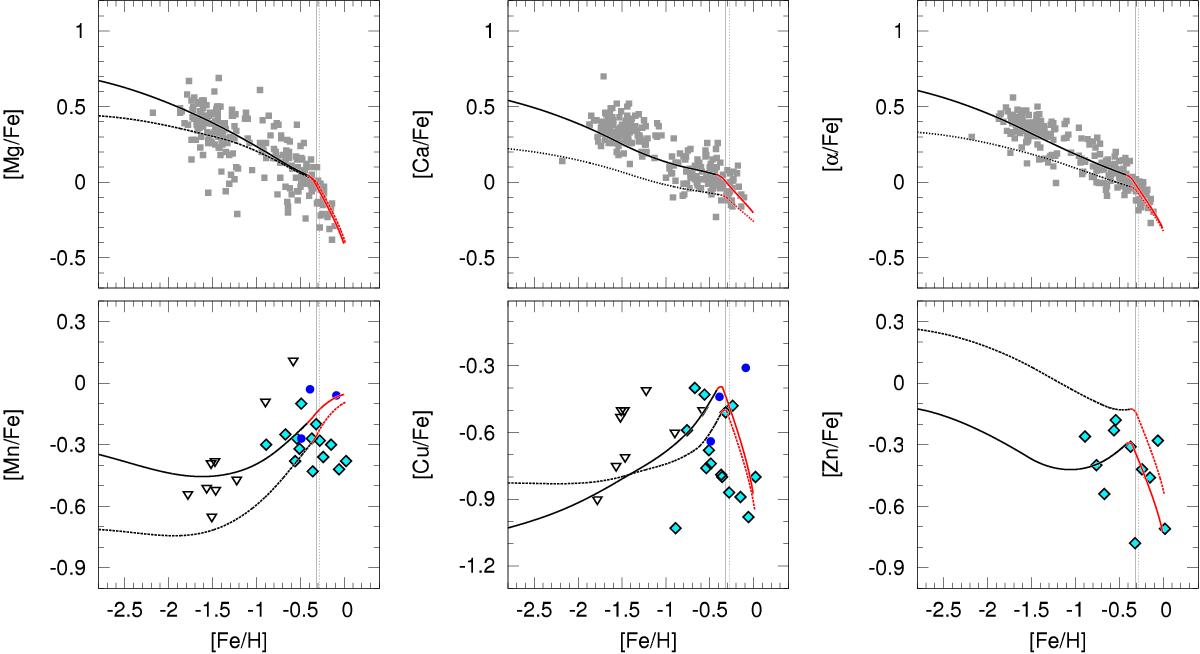
Run of [X/Fe] versus [Fe/H] for – clockwise from top left – Mg, Ca, α-elements, Zn, Cu, and Mn predicted with our chemical evolution model assuming that stars above 20 M⊙ explode as normal type II supernovae (solid curves) or as hypernovae (dotted curves). The red portions of the curves show the phases in which the stripping is active, while the vertical lines mark the end points of the tracks without stripping. The theoretical predictions are compared to data from this work (grey filled squares), Sbordone et al. (2007, cyan diamonds), Carretta et al. (2010b, upside-down triangles), and McWilliam et al. (2013, blue filled circles).
Current usage metrics show cumulative count of Article Views (full-text article views including HTML views, PDF and ePub downloads, according to the available data) and Abstracts Views on Vision4Press platform.
Data correspond to usage on the plateform after 2015. The current usage metrics is available 48-96 hours after online publication and is updated daily on week days.
Initial download of the metrics may take a while.