Fig. 11
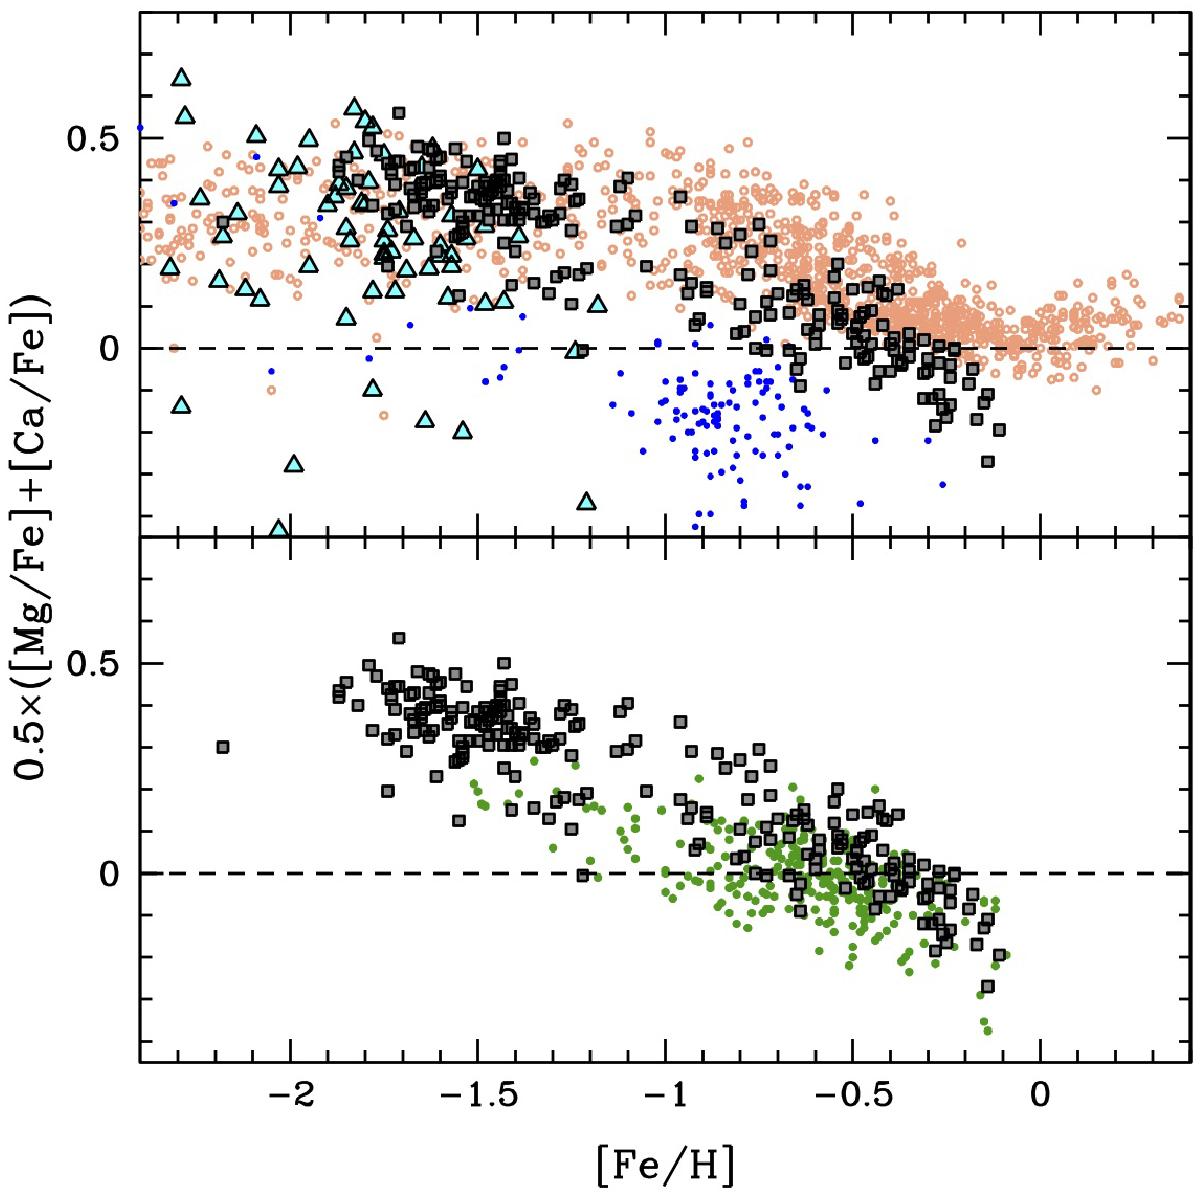
Behaviour of 0.5 ×( [Mg/Fe]+[Ca/Fe]) as a function of [Fe/H] for the whole sample (grey squares) in comparison with (upper panel) the Milky Way stars (red circles, Edvardsson et al. 1993; Burris et al. 2000; Fulbright 2000; Stephens & Boesgaard 2002; Gratton et al. 2003; Reddy et al. 2003, 2006; Barklem et al. 2005; Bensby et al. 2005), Fornax (blue dots, Letarte et al. 2010; Lemasle et al. 2014), and Carina stars (cyan triangles, Lemasle et al. 2012; Fabrizio et al. 2015), and with (lower panel) LMC stars (green dots, Lapenna et al. 2012; Van der Swaelmen et al. 2013).
Current usage metrics show cumulative count of Article Views (full-text article views including HTML views, PDF and ePub downloads, according to the available data) and Abstracts Views on Vision4Press platform.
Data correspond to usage on the plateform after 2015. The current usage metrics is available 48-96 hours after online publication and is updated daily on week days.
Initial download of the metrics may take a while.