Free Access
Fig. 7
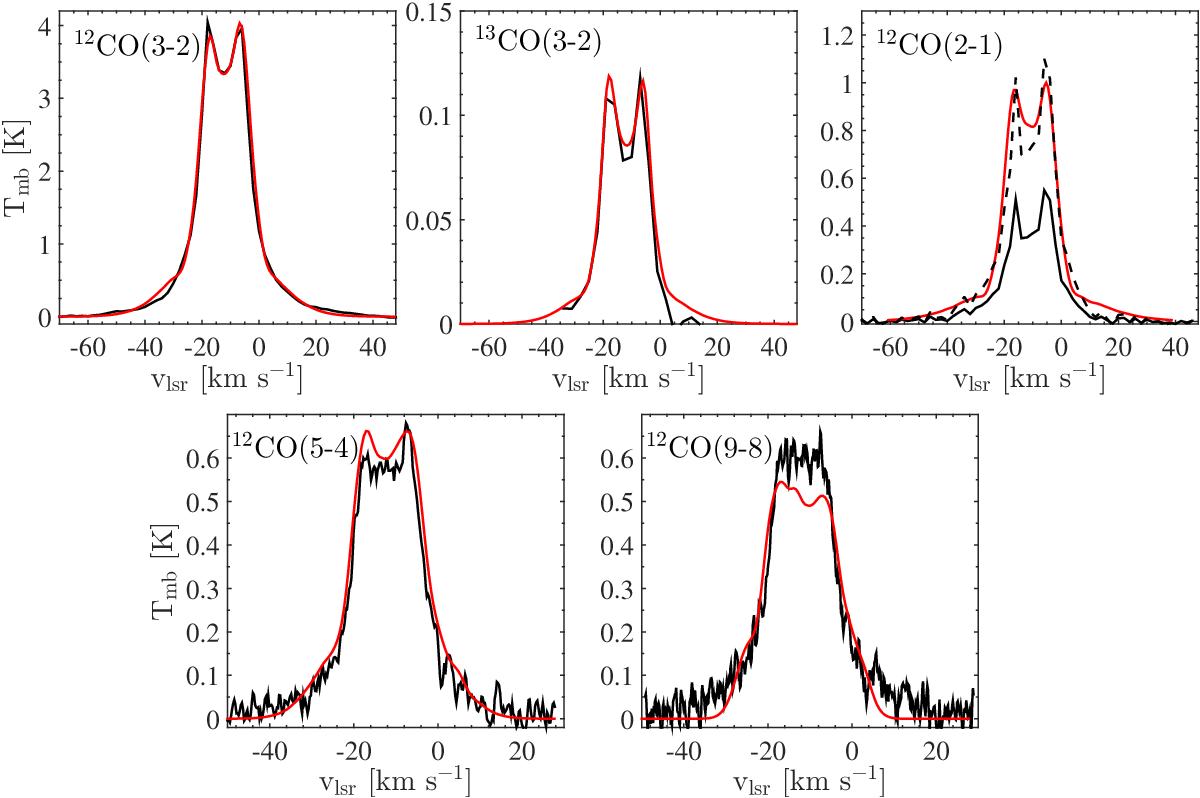
Line profiles from the observations (black) and the model (red). The black dashed line in the upper right panel shows the observed profile multiplied by a factor of 2 to correct for the missing flux according to Chiu et al. (2006).
Current usage metrics show cumulative count of Article Views (full-text article views including HTML views, PDF and ePub downloads, according to the available data) and Abstracts Views on Vision4Press platform.
Data correspond to usage on the plateform after 2015. The current usage metrics is available 48-96 hours after online publication and is updated daily on week days.
Initial download of the metrics may take a while.