Fig. 2
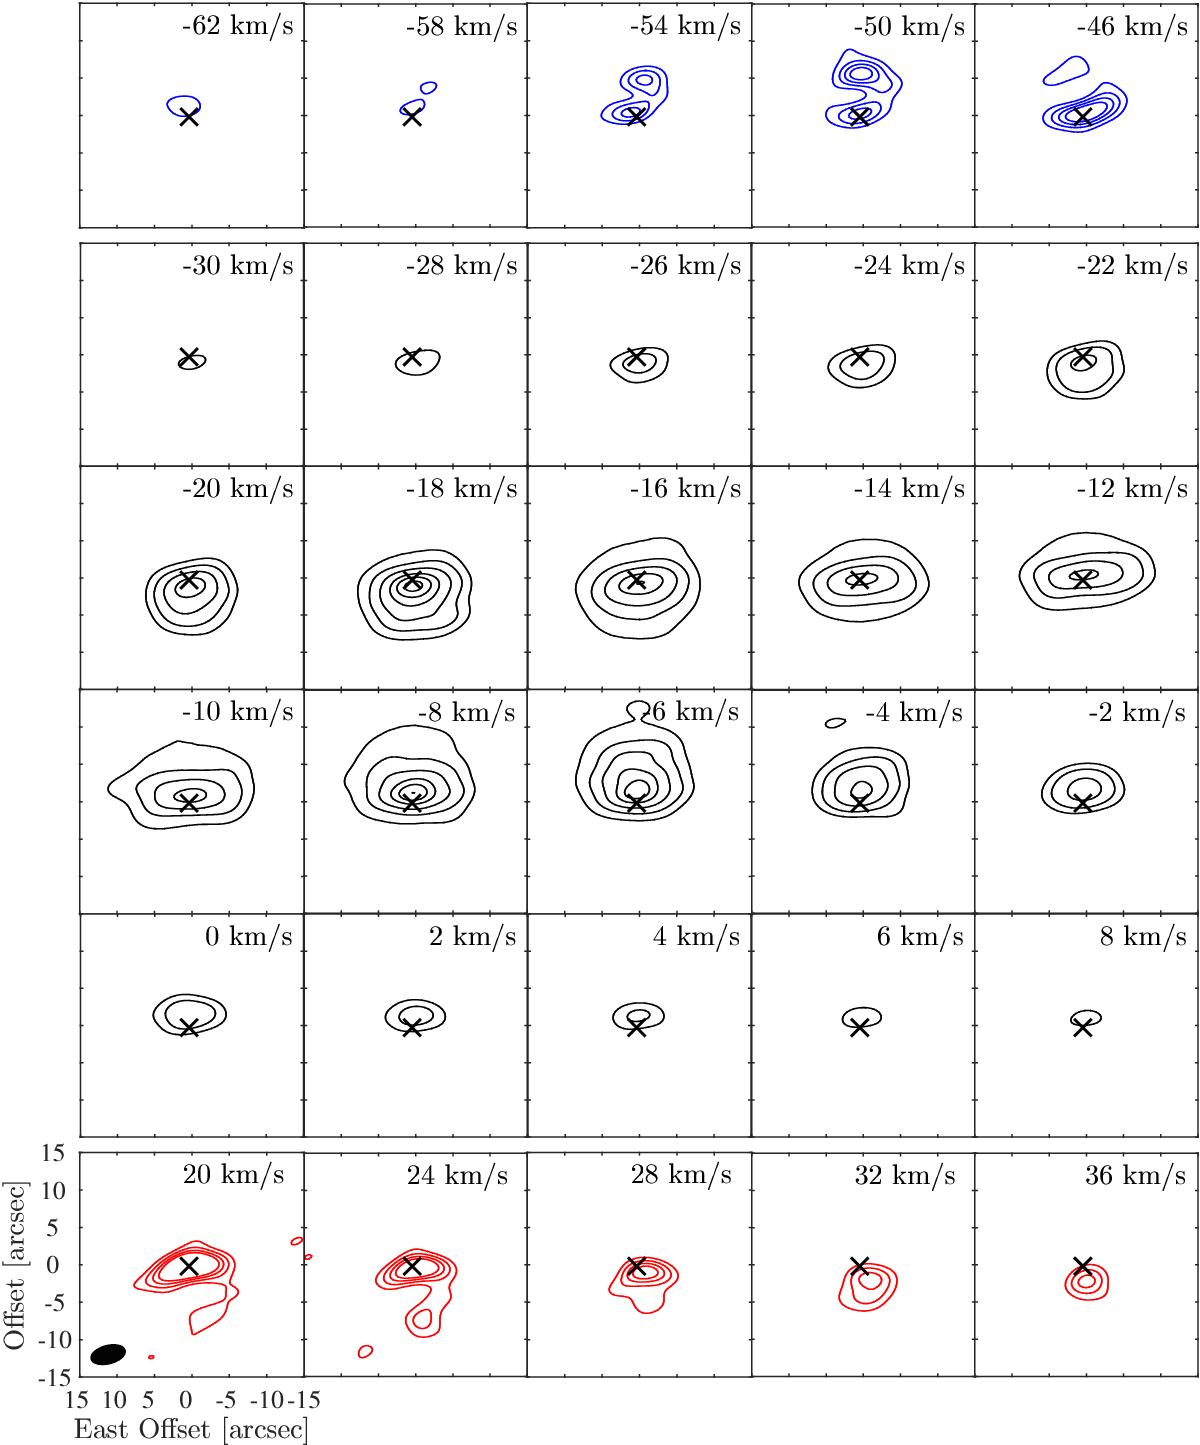
Contour maps of the 12CO J = 3–2 emission from the combined ALMA data. Contour levels are at 3, 5, 9, 15, 20, 25, and 30σ (σ = 1.2 Jy beam-1 for the middle rows, derived from the plotted channels), and at 3, 5, 7, and 9σ (σ = 0.08 Jy beam-1 for the first and last rows, derived from the plotted channels). The synthesized beam size of ![]() at a PA of –81° is plotted in the lower left corner of the 20 km s-1 channel. The local standard of rest velocity is given in the upper right corner of each channel. A cross denotes the stellar position determined from the continuum emission.
at a PA of –81° is plotted in the lower left corner of the 20 km s-1 channel. The local standard of rest velocity is given in the upper right corner of each channel. A cross denotes the stellar position determined from the continuum emission.
Current usage metrics show cumulative count of Article Views (full-text article views including HTML views, PDF and ePub downloads, according to the available data) and Abstracts Views on Vision4Press platform.
Data correspond to usage on the plateform after 2015. The current usage metrics is available 48-96 hours after online publication and is updated daily on week days.
Initial download of the metrics may take a while.