Fig. 1
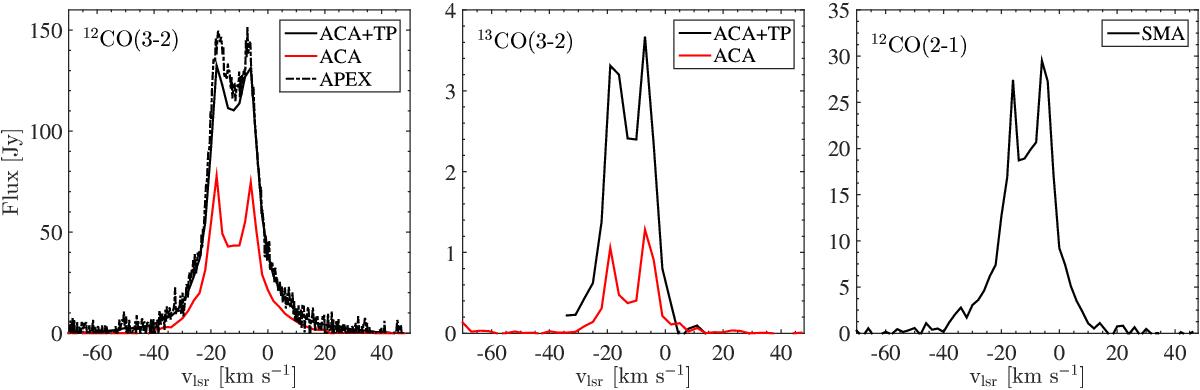
Total flux of the 12CO J = 3–2 (left) and 13CO J = 3–2 (middle) emission from the ALMA-ACA data (red) and the combined (ACA+TP) data (black). The spectra were generated by convolving the images with the APEX beam (FWHM = 18″). The 12CO J = 3–2 spectrum (Ramstedt et al. 2006) from APEX (FWHM = 18″) is plotted for comparison. Owing to the artificial feature (explained in Sect. 3.2) in the blueshifted wing of the 13CO J = 3–2 line, the line profile of the combined data was only plotted from –35 km s-1. The 12CO J = 2–1 spectrum (right) from the SMA observation (Chiu et al. 2006) was generated by convolving the image with the SMA primary beam of 55″.
Current usage metrics show cumulative count of Article Views (full-text article views including HTML views, PDF and ePub downloads, according to the available data) and Abstracts Views on Vision4Press platform.
Data correspond to usage on the plateform after 2015. The current usage metrics is available 48-96 hours after online publication and is updated daily on week days.
Initial download of the metrics may take a while.