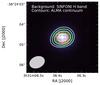
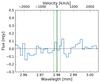
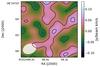
Fig. 6

HB8903: a) white contours show the continuum emission from HB8903 at 3 mm with a beam of 0.62′′×0.46′′ (the synthesised beam is shown in the bottom-left corner). Contours are at the level of 25, 50, 100 and 200 times the noise per beam (18 μJy). The colour background image shows the continuum emission in H-band from SINFONI data of HB8903. b) ALMA spectrum extracted from an aperture as large as the beam size and rebinned to 120 km s-1. The vertical dashed and solid green line mark the expected positions for CO(3−2) emission line at the redshifted of the narrow Hα and [Oiii]λ5007 component, respectively (Carniani et al. 2016): the line is not detected. c) CO(3−2) map obtained by integrating the cube under the two vertical dotted line indicated in the panel b (i.e. − 200 km s-1<v< 200 km s-1). Negative and positive contours are in steps of 1σ, which is 0.027 Jy/beam km s-1. The synthesised beam is shown in the bottom-left corner.
Current usage metrics show cumulative count of Article Views (full-text article views including HTML views, PDF and ePub downloads, according to the available data) and Abstracts Views on Vision4Press platform.
Data correspond to usage on the plateform after 2015. The current usage metrics is available 48-96 hours after online publication and is updated daily on week days.
Initial download of the metrics may take a while.