Fig. 5

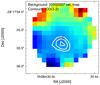
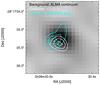
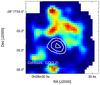
2QZJ0028: from left to right: [Oiii]λ5007 velocity map by Carniani et al. (2015b), ALMA continuum map at 3 mm, and narrow Hα emission tracing SF in the host galaxy (Cano-Díaz et al. 2012). White contours trace the flux map of CO(3−2) emission at the levels 3, 4 and 5σ. The red cross indicates the centroid of the H-band continuum emission. The cyan contours in the middle panel shows the flux map of the blue [Oiii]λ5007 wings collapsing the SINFONI cube over the velocity range − 2500 <v< − 2300 km s-1.
Current usage metrics show cumulative count of Article Views (full-text article views including HTML views, PDF and ePub downloads, according to the available data) and Abstracts Views on Vision4Press platform.
Data correspond to usage on the plateform after 2015. The current usage metrics is available 48-96 hours after online publication and is updated daily on week days.
Initial download of the metrics may take a while.