Fig. 4

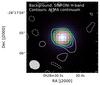
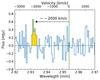
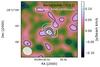
2QZJ0028: a) white contours show the continuum emission from 2QZJ0028 at 3 mm with a bean of 0.64′′×0.53′′. Contours are at the level of 3, 5 and 7 times the noise per beam (12 μJy). The color background image shows the continuum emission in H-band from SINFONI data of 2QZJ0028. b) ALMA spectrum extracted from an aperture as large as the beam size and rebinned to 60 km s-1. The vertical dashed green line mark the expected positions for CO(3−2) emission line at the redshifted of the narrow Hα component (Cano-Díaz et al. 2012): the line is not detected. An emission line is detected at a velocity of ~ − 2000 km s-1 with respect to the redshift of 2QZJ0028. c) CO(3−2) surface brightness. Black solid contours are at the levels of 2σ, 3σ, 4σ and 5σ, where σ is 0.03 Jy/beam km s-1. The white contours show the continuum emission at 3 mm at the levels of 3, 6, and 9 times the sensitivity of the continuum map. The synthesised beam is shown in the bottom-left corner.
Current usage metrics show cumulative count of Article Views (full-text article views including HTML views, PDF and ePub downloads, according to the available data) and Abstracts Views on Vision4Press platform.
Data correspond to usage on the plateform after 2015. The current usage metrics is available 48-96 hours after online publication and is updated daily on week days.
Initial download of the metrics may take a while.