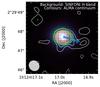
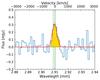
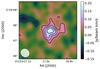
Fig. 1

LBQS0109: a) white contours show the ALMA 3 mm continuum emission in correspondence of LBQS0109 at an angular resolution of 0.64′′×0.53′′. Contours correspond to − 2, 2, 3, 4 and 5 times the noise per beam (12 μJy). The colour background image shows the continuum emission in H band from SINFONI observations. The blue arrow indicates the direction of the ionised outflow revealed by the kinematic analysis of the broad [Oiii]λ5007 line (Carniani et al. 2015a). b) CO(3−2) spectrum extracted from an aperture as large as the synthesised beam size of the ALMA observations and re-binned to 120 km s-1. The vertical green solid and dotted lines mark the expected CO(3−2) central wavelength based on the redshift of the narrow Hα and [Oiii]λ5007 component, respectively (Carniani et al. 2016). The dashed red curve shows the best fit Gaussian profile. c) CO(3−2) surface brightness map. Black solid contours are at the levels of 2σ, 3σ, 4σ and 5σ of the CO(3−2) flux map, where σ is 0.03 Jy/beam km s-1. The 2σ negative contours are indicated by the black dashed curves. The synthesised beam is shown in the bottom-left corner of the map.
Current usage metrics show cumulative count of Article Views (full-text article views including HTML views, PDF and ePub downloads, according to the available data) and Abstracts Views on Vision4Press platform.
Data correspond to usage on the plateform after 2015. The current usage metrics is available 48-96 hours after online publication and is updated daily on week days.
Initial download of the metrics may take a while.