Fig. 6
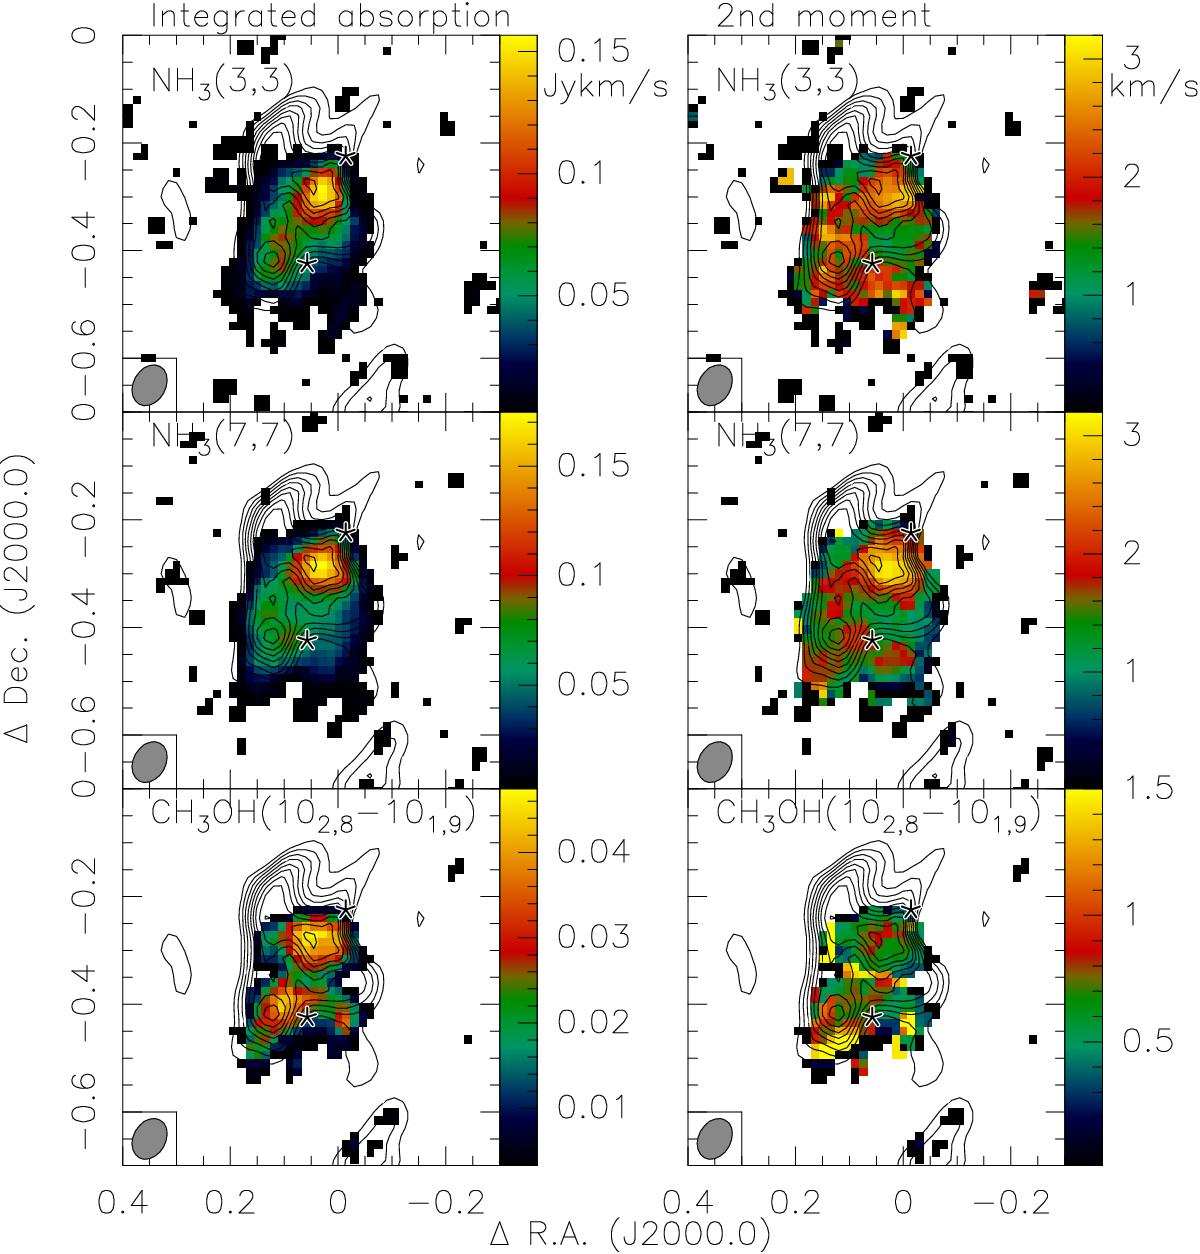
Integrated (left) and 2nd moment (right) maps (intensity-weighted velocity dispersion) for two NH3 and one CH3OH line as indicated in each panel. The integration ranges for NH3(3, 3), (7, 7) and CH3OH(102,8−101,9) are [–68, –50] km s-1, [–65, –50] km s-1 and [–65, –53] km s-1, respectively. The contours show in all panels the 1.2 cm continuum emission in levels of 8% to 98% of the peak emission (7.4 mJy beam-1). The two stars indicate the CH3OH maser positions by Moscadelli & Goddi (2014). The synthesized beams are shown in the bottom left of each panel.
Current usage metrics show cumulative count of Article Views (full-text article views including HTML views, PDF and ePub downloads, according to the available data) and Abstracts Views on Vision4Press platform.
Data correspond to usage on the plateform after 2015. The current usage metrics is available 48-96 hours after online publication and is updated daily on week days.
Initial download of the metrics may take a while.