Fig. 4
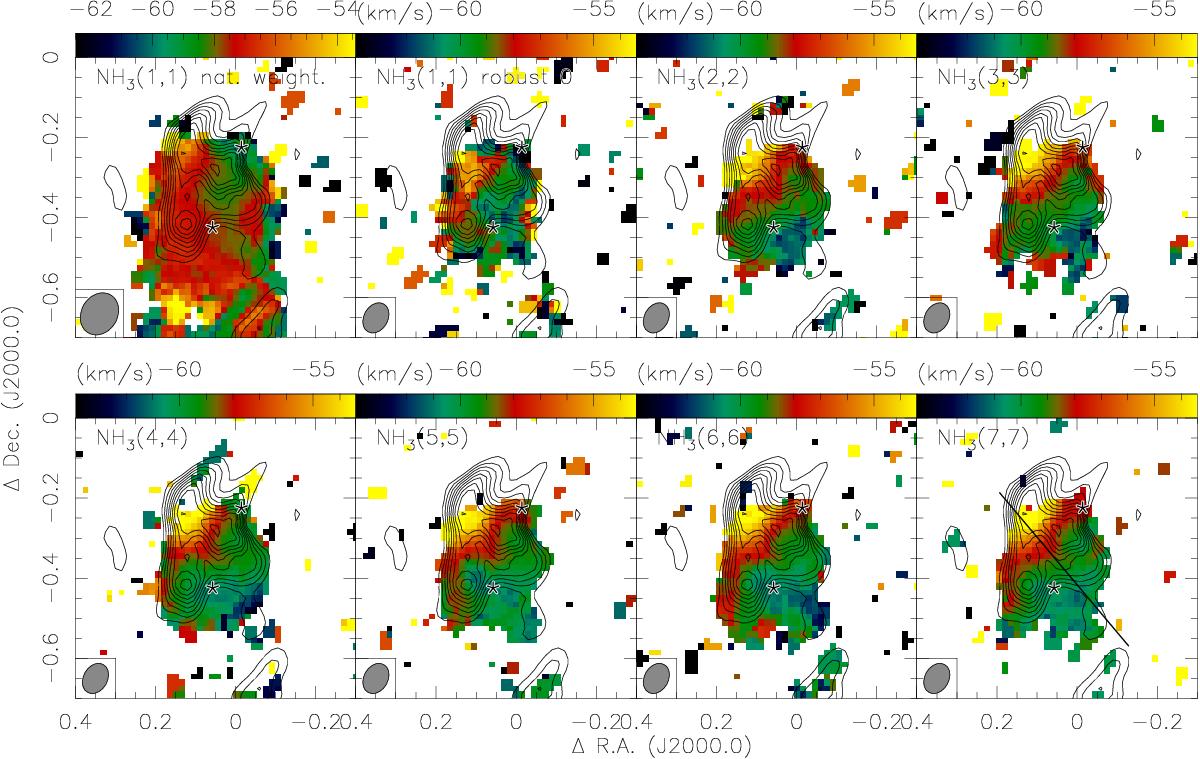
Color-scale presents the 1st moment maps (intensity-weighted velocities) of the NH3 inversion transitions from (1, 1) to (7, 7) as indicated in each panel. The first two left panels show the data for the NH3(1, 1) line with different weighting schemes (natural weighting and robust weighting, which is a hybrid between natural and uniform weighting). The other NH3 lines are always presented with robust weighting 0. The 1st moment maps are clipped at a ~4σ level. The contours show in all panels the 1.2 cm continuum emission in levels of 8% to 98% of the peak emission (7.4 mJy beam-1). The two stars indicate the CH3OH maser positions by Moscadelli & Goddi (2014). The line in the bottom right panel indicates the position-velocity cut shown below.
Current usage metrics show cumulative count of Article Views (full-text article views including HTML views, PDF and ePub downloads, according to the available data) and Abstracts Views on Vision4Press platform.
Data correspond to usage on the plateform after 2015. The current usage metrics is available 48-96 hours after online publication and is updated daily on week days.
Initial download of the metrics may take a while.