Fig. 1
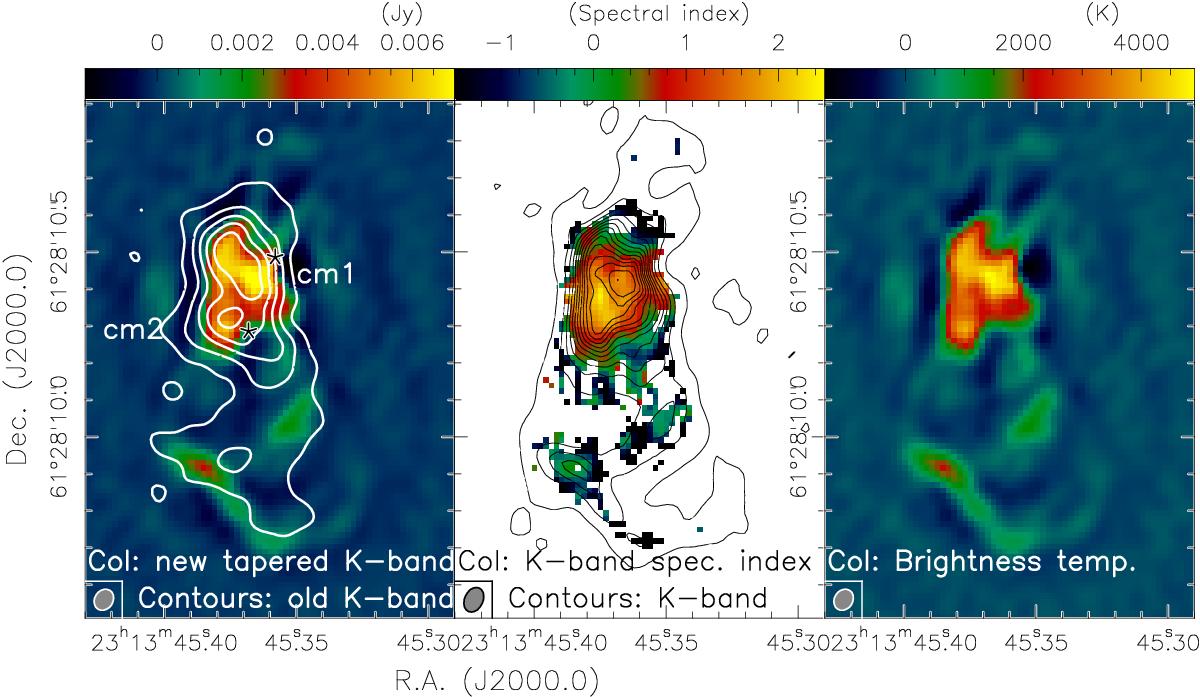
Centimeter continuum emission from NGC 7538IRS1. The left panel shows in color scale the new 1.2 cm continuum data imaged using only baselines between 10 and 37 km, achieving a spatial resolution of 0.06″ × 0.05″. The contours present for comparison the old VLA data from 1992 discussed previously in Gaume et al. (1995a), Sandell et al. (2009), Moscadelli & Goddi (2014), and Goddi et al. (2015) starting at the 4σ contour and continuing in 8σ intervals (1σ ~ 0.05 mJy beam-1). The two stars indicate the CH3OH maser positions by Moscadelli & Goddi (2014); see Sect. 3.1 for more details. The middle panel shows in color the spectral index map derived from the new full dataset with robust weighting −2 and the contours show the corresponding continuum image using all data at a resolution of 0.07″ × 0.05″. The contour levels start at a 4σ levels of 0.16 mJy beam-1 and continue in coarser 32σ steps. The right panel again shows the new 0.06″ × 0.05″ data, now converted in the Rayleigh-Jeans approximation to brightness temperature.
Current usage metrics show cumulative count of Article Views (full-text article views including HTML views, PDF and ePub downloads, according to the available data) and Abstracts Views on Vision4Press platform.
Data correspond to usage on the plateform after 2015. The current usage metrics is available 48-96 hours after online publication and is updated daily on week days.
Initial download of the metrics may take a while.