Fig. 7
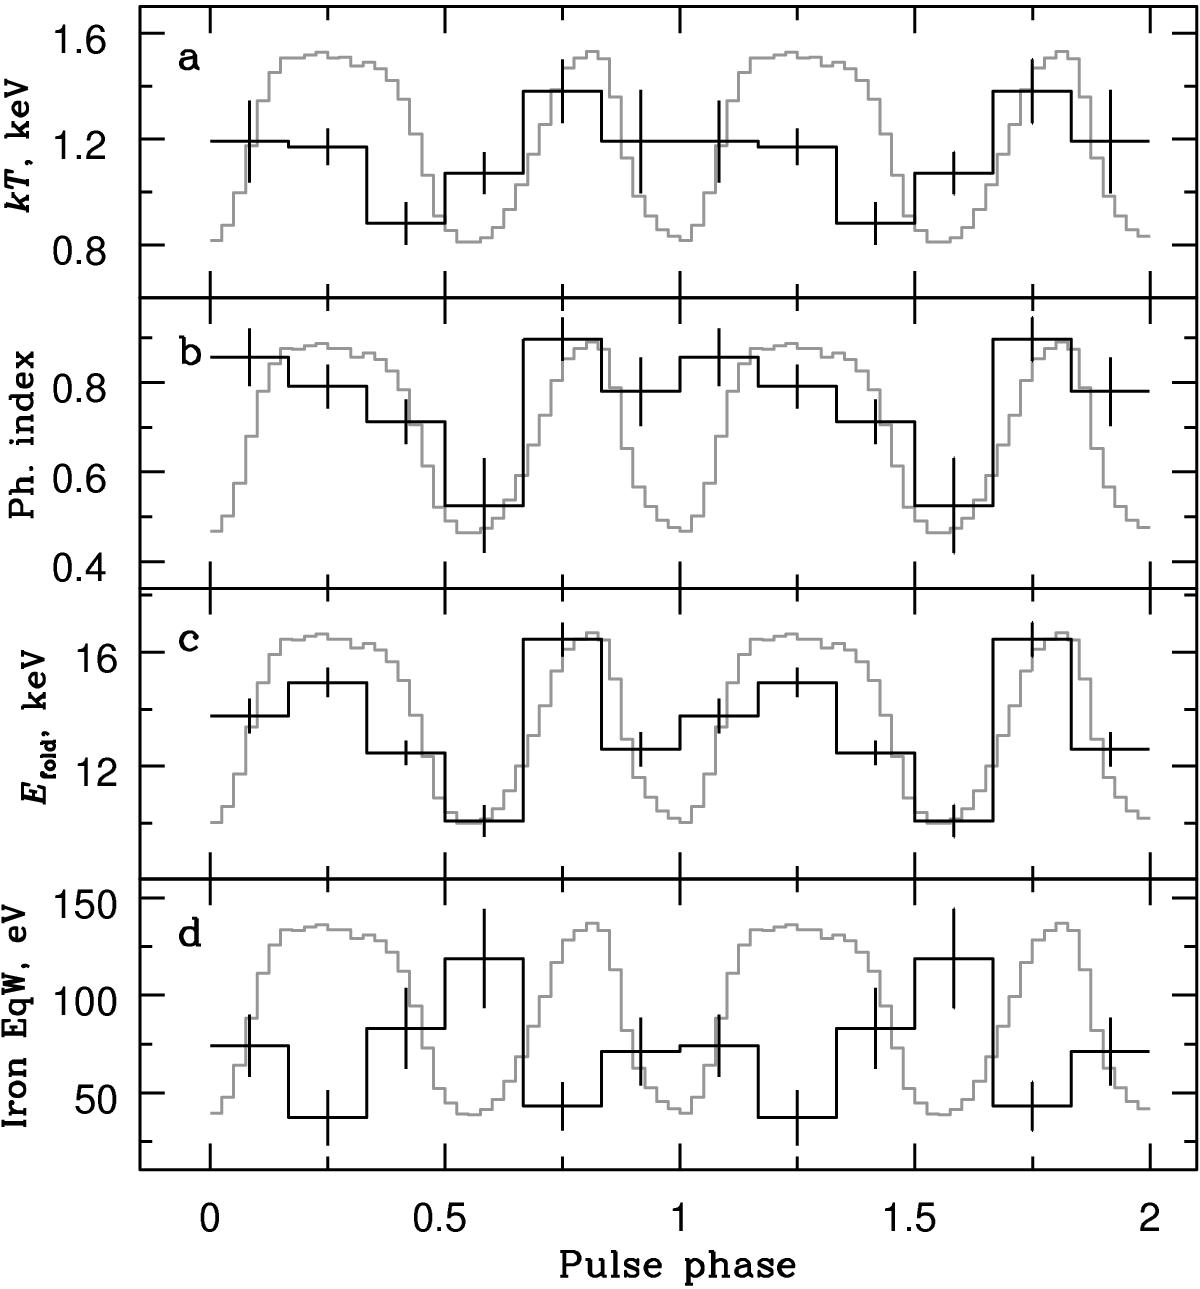
Variations of spectral parameters of SMC X-3 over the pulse phase for the high luminosity state (NuSTAR observation ID 90201035002). The black histogram in the panels represents: a) blackbody temperature, b) photon index, c) folding energy and d) equivalent width of the iron emission line. The gray line in each panel shows the pulse profile in a wide energy range.
Current usage metrics show cumulative count of Article Views (full-text article views including HTML views, PDF and ePub downloads, according to the available data) and Abstracts Views on Vision4Press platform.
Data correspond to usage on the plateform after 2015. The current usage metrics is available 48-96 hours after online publication and is updated daily on week days.
Initial download of the metrics may take a while.