Fig. 4
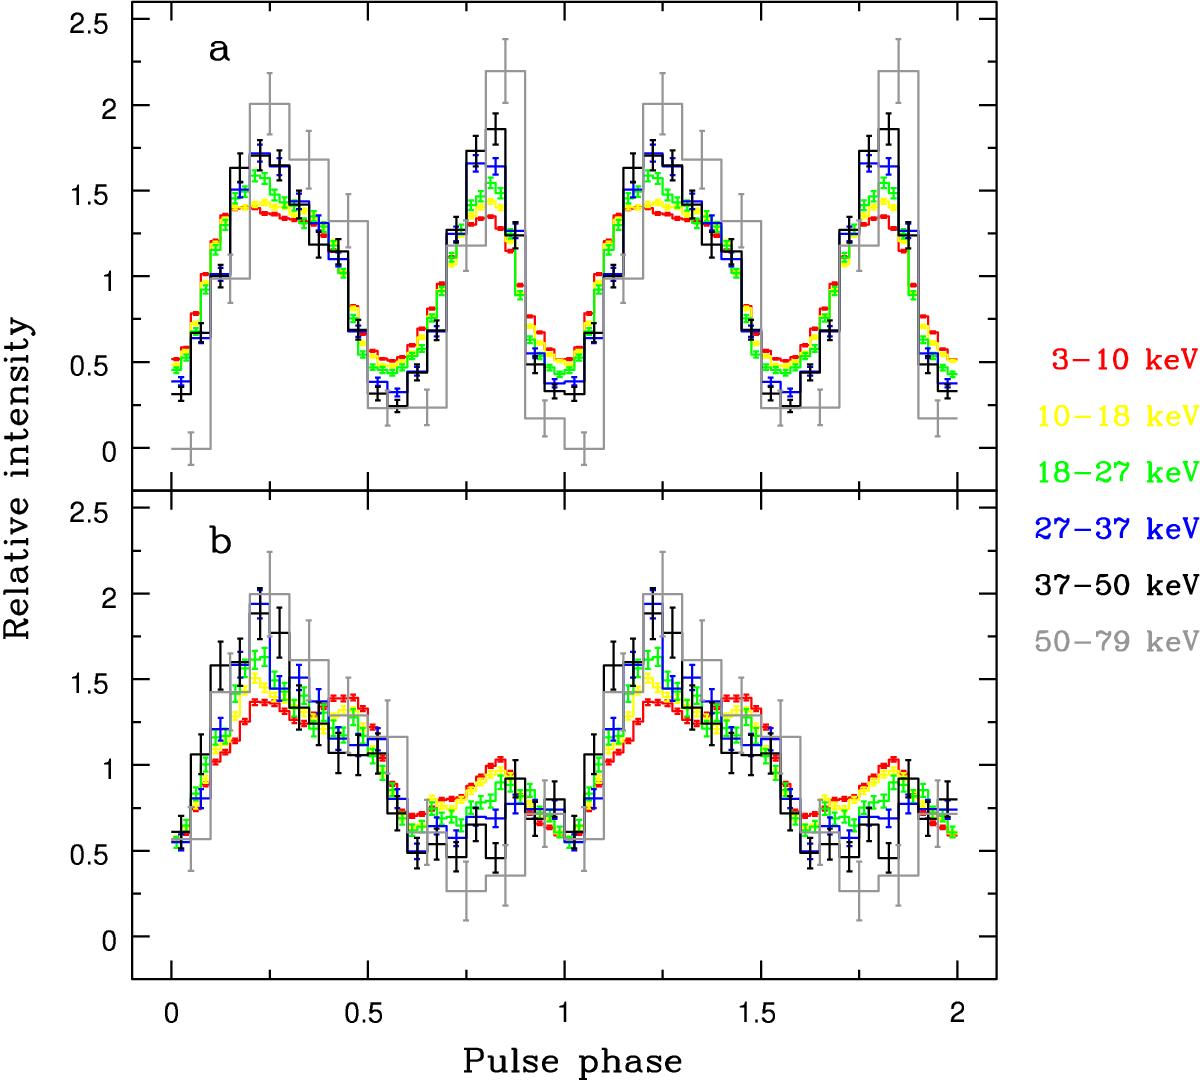
Dependence of the pulse profile of SMC X-3 on energy in two NuSTAR observations. Different panels correspond to different X-ray luminosities: a) Lbol = 10.2 × 1038 erg s-1 (ObsID 90201035002), b)Lbol = 1.9 × 1038 erg s-1 (ObsID 90201041002). Different energy bands are shown with different colors (shown on the right). The profiles are normalized by the mean flux in each energy band and plotted twice for clarity.
Current usage metrics show cumulative count of Article Views (full-text article views including HTML views, PDF and ePub downloads, according to the available data) and Abstracts Views on Vision4Press platform.
Data correspond to usage on the plateform after 2015. The current usage metrics is available 48-96 hours after online publication and is updated daily on week days.
Initial download of the metrics may take a while.