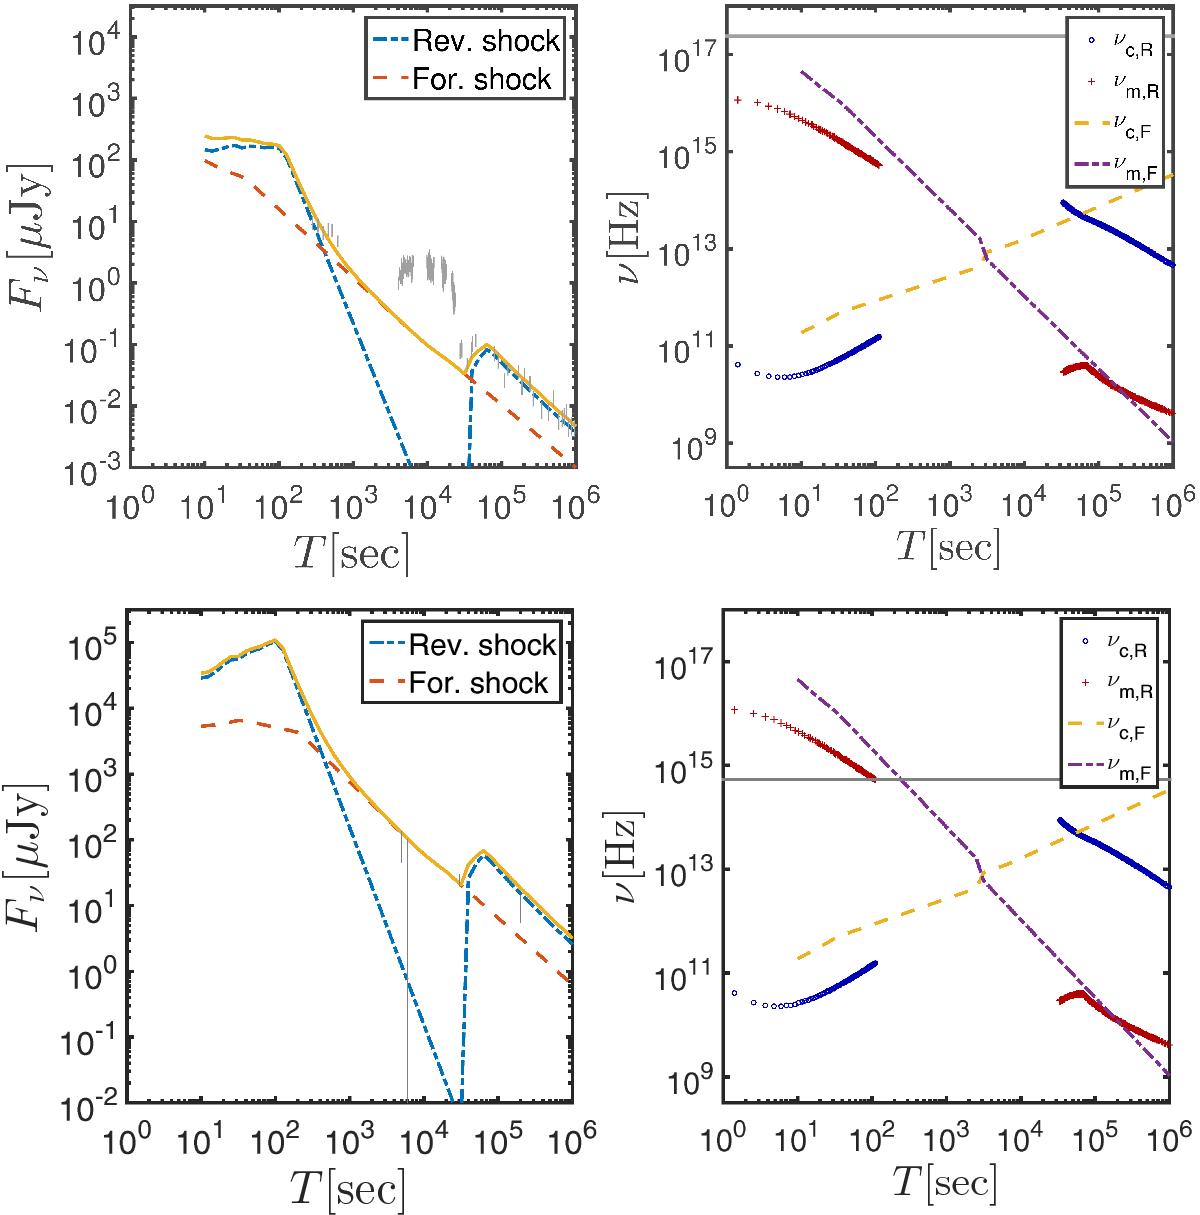
Fig. 3

Light-curves corresponding to reverse and forward shock emission assuming the ejecta responsible for the prompt emission is followed by slower moving outflow with Γs = 20, Ės = 2 × 1049 erg s-1 and lasting 6000 s, which makes the plateau. The tail of this material is characterized by the same Ė, lasting 400 s and with a declining Lorentz factor from Γ ≈ 20 down to Γ ≈ 1 with Γ(tinj) ∝ (tf−tinj)2/11. The reverse shock crossing this material accounts for a bump in the afterglow data. The time of the bump and the flux levels during and after the bump match the observed levels. We assume here A∗ = 2.2,ϵe,f = 0.1,ϵB,f = 2.5 × 10⁻⁵,ϵe,r = 0.1,ϵB,r = 4 × 10⁻³,p = 2.15. The top panels correspond to the 1 keV light curve and the bottom panels correspond to the 1 eV light curve. Left: light curve for the reverse shock (blue dot-dashed line) and forward shock (red dashed line). A yellow solid line depicts the sum of the reverse and forward shock contributions. Right: the plots show the evolution of νc,R (blue circles), νm,R (red pluses), νc,f (yellow dashed line) and νm,f (purple dot-dashed line). The observed frequency is depicted by a horizontal line.
Current usage metrics show cumulative count of Article Views (full-text article views including HTML views, PDF and ePub downloads, according to the available data) and Abstracts Views on Vision4Press platform.
Data correspond to usage on the plateform after 2015. The current usage metrics is available 48-96 hours after online publication and is updated daily on week days.
Initial download of the metrics may take a while.


