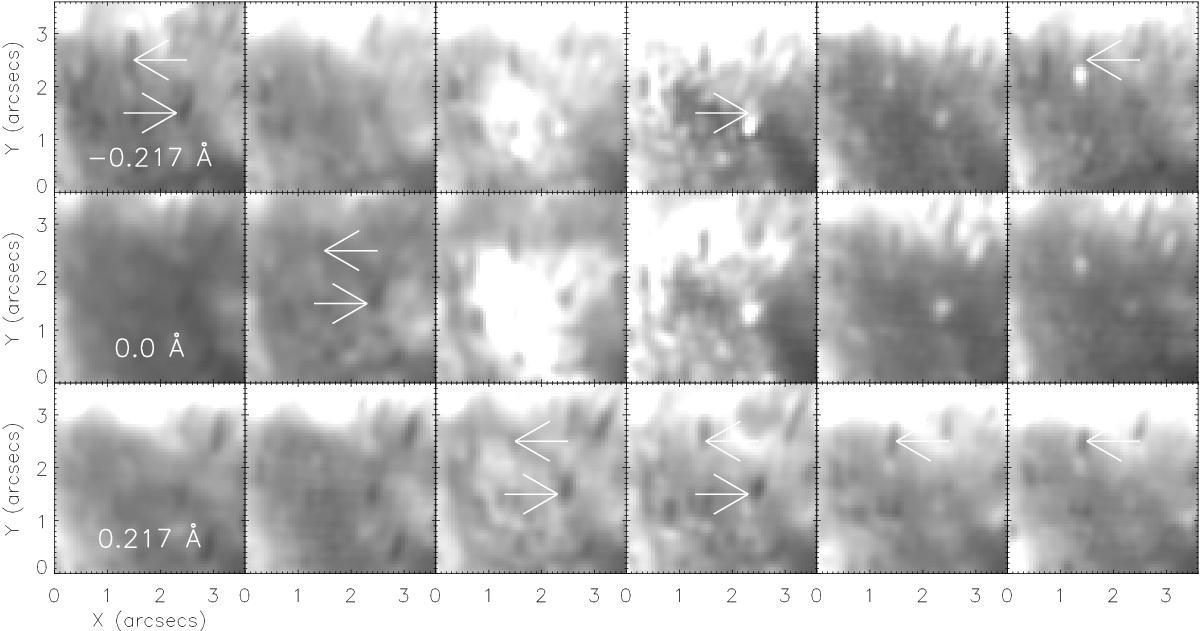
Fig. 9

Top row: evolution of a FOV around two SSUBs (including the event plotted in the top left panel of Fig. 6) at − 0.217 Å into the blue wing of the Ca ii 8542 Å line. Each column is separated in time by about 29 s. Middle row: same as the top row but for the Ca ii 8542 Å line core. Bottom row: same as above but for 0.217 Å into the red wing of the Ca ii 8452 Å profile. Arrows indicate the positions of the co-spatial short dynamic fibrils. The SSUBs are clearly visible in the fourth and sixth columns of the − 0.217 Å and line core images (indicated by white arrows in the fourth and sixth frames of the top row).
Current usage metrics show cumulative count of Article Views (full-text article views including HTML views, PDF and ePub downloads, according to the available data) and Abstracts Views on Vision4Press platform.
Data correspond to usage on the plateform after 2015. The current usage metrics is available 48-96 hours after online publication and is updated daily on week days.
Initial download of the metrics may take a while.


