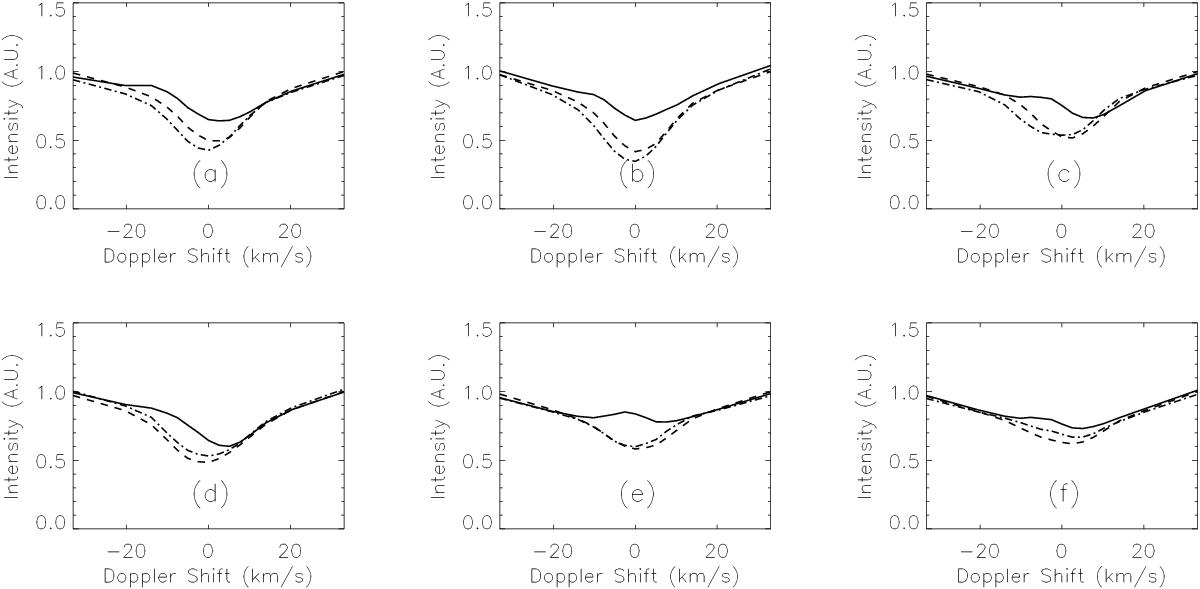
Fig. 6

a)–c) Ca ii 8542 Å line profiles (averaged over 5 pixels and with Doppler shift referenced against the Ca ii 8542 Å line core) of three SSUBs which occurred close to an umbral flash. d)–f) The same as the top row but for three SSUBs not visibly associated with an umbral flash. For each frame, the solid line plots the profile during the occurrence of the SSUB, the dashed line plots the scan one minute prior to the formation of the feature, and the dot-dashed line corresponds to the scan measured one minute after the SSUB.
Current usage metrics show cumulative count of Article Views (full-text article views including HTML views, PDF and ePub downloads, according to the available data) and Abstracts Views on Vision4Press platform.
Data correspond to usage on the plateform after 2015. The current usage metrics is available 48-96 hours after online publication and is updated daily on week days.
Initial download of the metrics may take a while.


