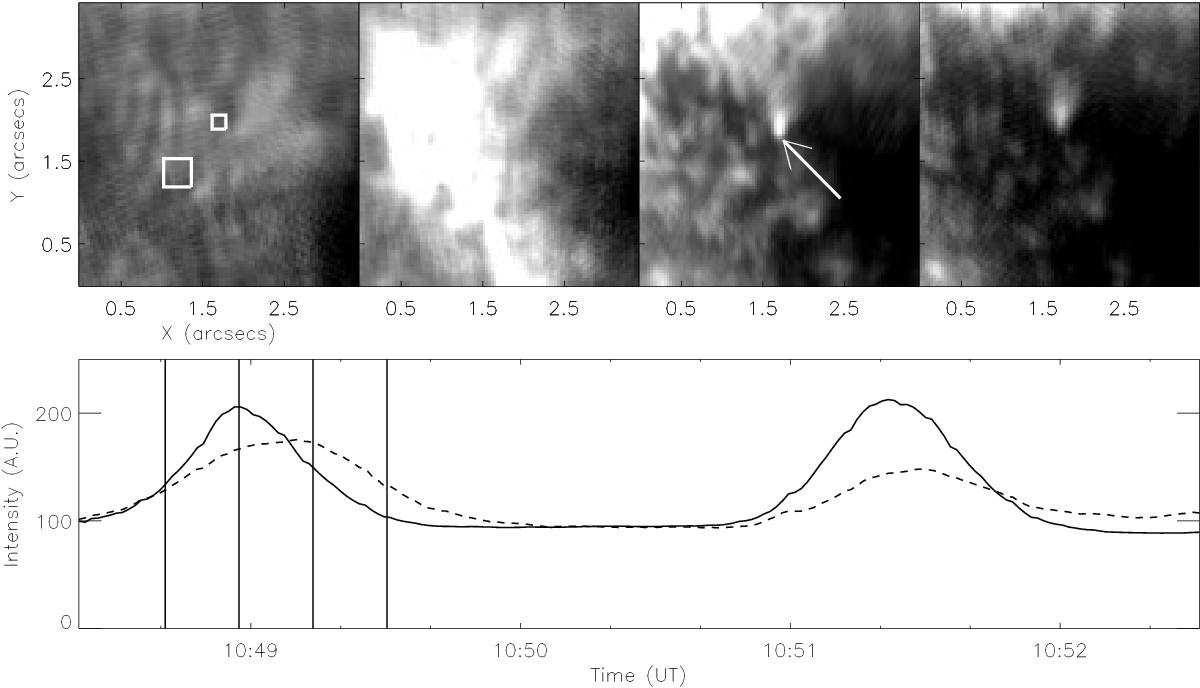
Fig. 5

Top row: evolution of a region of Ca ii H data displaying an umbral flash followed closely by a SSUB. Each frame is separated by 16.8 s. The large and small boxes in the left-hand panel indicate the regions which are averaged to create the lightcurves plotted in the bottom panel. Bottom row: a lightcurve plotting the intensity evolution of the umbral flash (solid line) and SSUB (dashed line). The solid vertical lines indicate the frames plotted in the top row. A second flash and SSUB pairing is also evident between 10:51 UT and 10:52 UT. A distinct time-lag between the peak intensities of the phenomena can be identified for both pairings.
Current usage metrics show cumulative count of Article Views (full-text article views including HTML views, PDF and ePub downloads, according to the available data) and Abstracts Views on Vision4Press platform.
Data correspond to usage on the plateform after 2015. The current usage metrics is available 48-96 hours after online publication and is updated daily on week days.
Initial download of the metrics may take a while.


