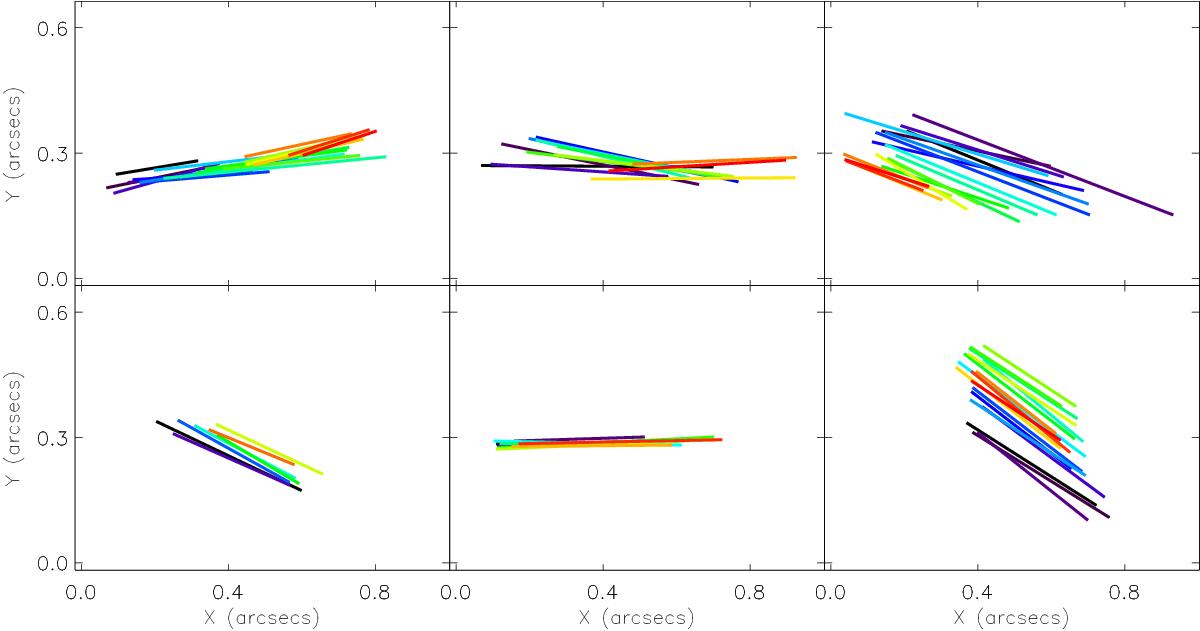
Fig. 4

Time evolution of six representative SSUB features. The evolution of colour, from dark purple (feature first identified) to green (middle of lifetime) to red (final frame in which feature is visible), shows the passage of time. The axis are plotted to give an indication of length (i.e. they are not solar co-ordinates and do not correspond to the axes of Fig. 1). This means that the initial positioning of the events in each frame is arbitrary. However, the relative shifts depict the measured motions of the events through time.
Current usage metrics show cumulative count of Article Views (full-text article views including HTML views, PDF and ePub downloads, according to the available data) and Abstracts Views on Vision4Press platform.
Data correspond to usage on the plateform after 2015. The current usage metrics is available 48-96 hours after online publication and is updated daily on week days.
Initial download of the metrics may take a while.


