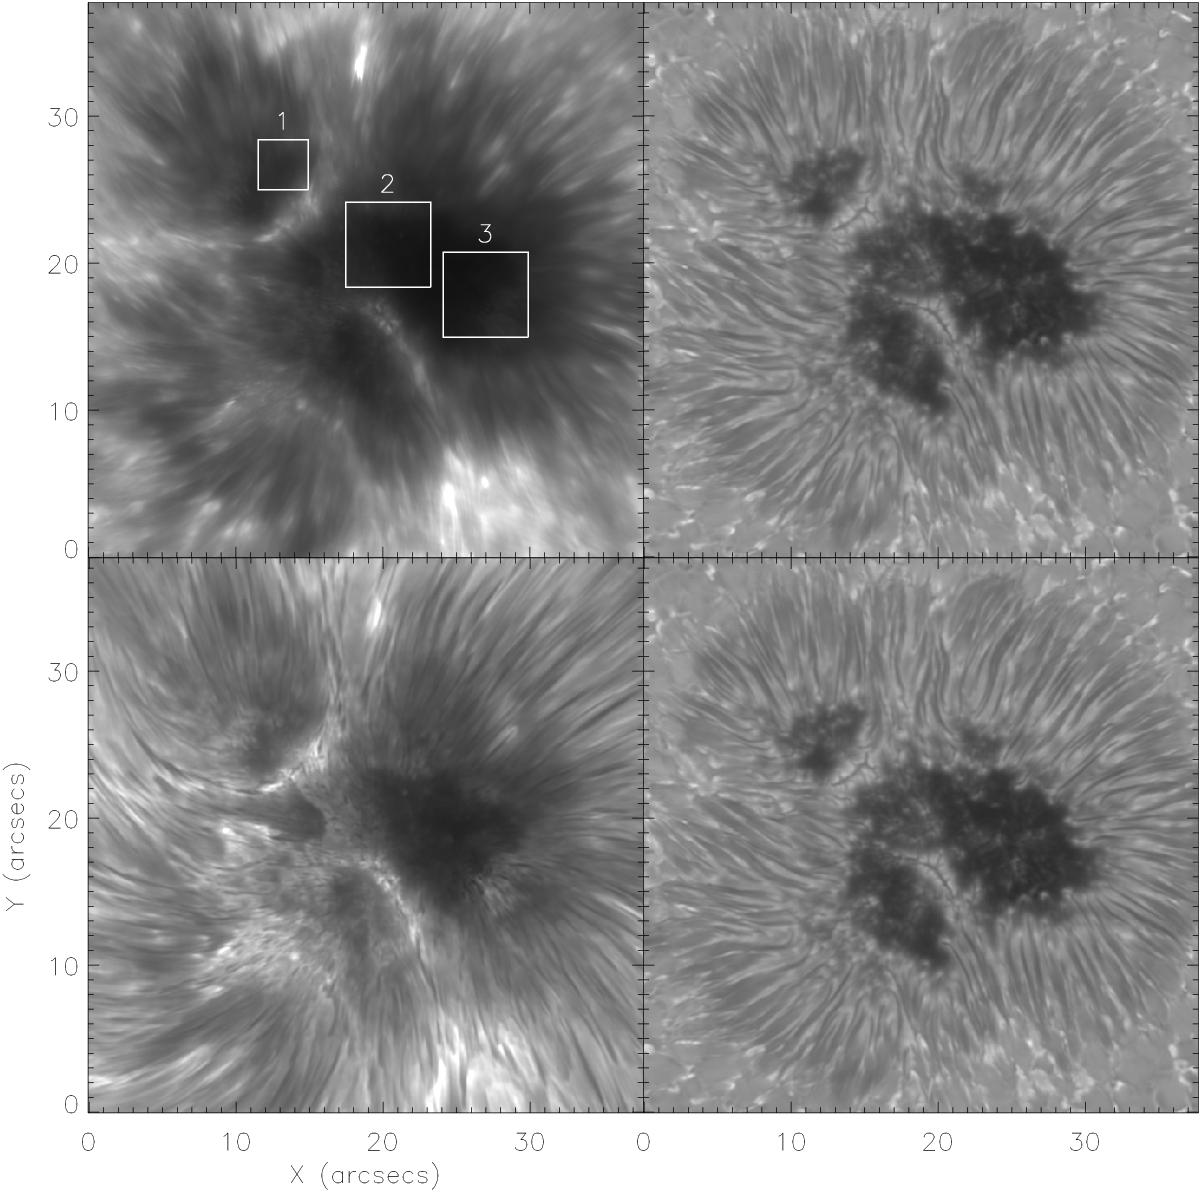
Fig. 1

Context image of the sunspot analysed in this investigation at 10:49:52 UT. Plotted clockwise from the top left are: a Ca ii H line core filtergram image, the blue wing (− 0.942 Å) of the Ca ii 8542 Å line; the red wing (+0.942 Å) of the Ca ii 8542 Å line; and the Ca ii 8542 Å line core. The numbered white boxes in the top left frame indicate the regions of the umbra analysed in detail in this paper.
Current usage metrics show cumulative count of Article Views (full-text article views including HTML views, PDF and ePub downloads, according to the available data) and Abstracts Views on Vision4Press platform.
Data correspond to usage on the plateform after 2015. The current usage metrics is available 48-96 hours after online publication and is updated daily on week days.
Initial download of the metrics may take a while.


