Fig. 6
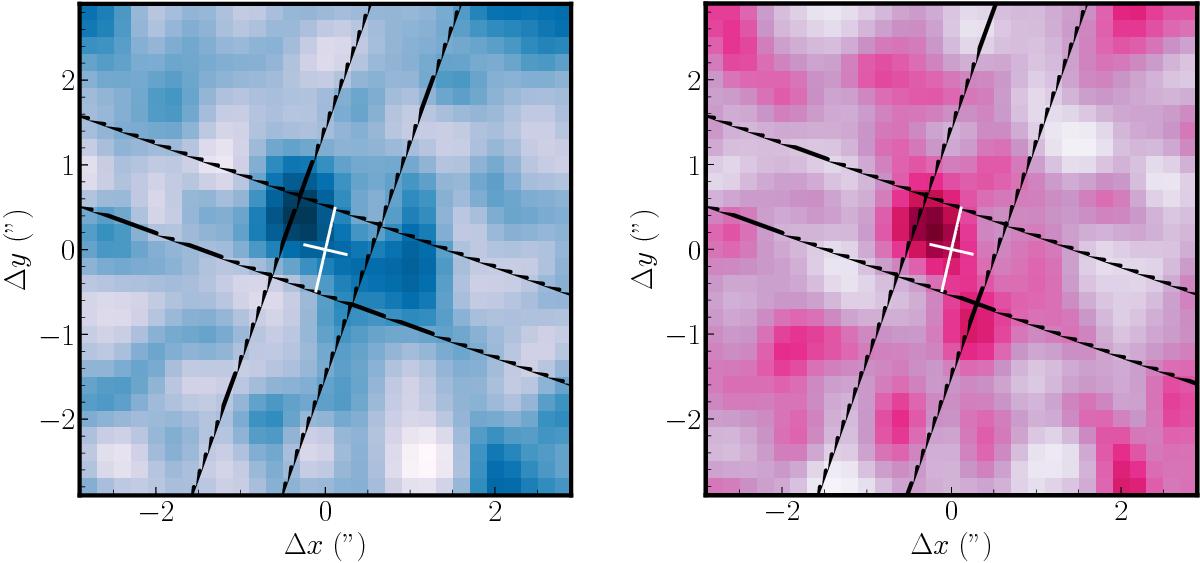
Maps of the Fe ii* emission from the blue-shifted (left) and redshifted (right) outflow components with 2 × 2 Gaussian smoothing. The black lines show the two slit positions at +70°, and −20°. The white crosses indicate the galaxy major and minor axes from the Contini et al. (2016) kinematic analysis of [O ii]. The strongest emission from both the red and the blue-shifted components is roughly spatially coincident. In the case of a bi-conical outflow, this suggests that we may be observing emission predominantly from the base of the wind, not far from the plane of the galaxy.
Current usage metrics show cumulative count of Article Views (full-text article views including HTML views, PDF and ePub downloads, according to the available data) and Abstracts Views on Vision4Press platform.
Data correspond to usage on the plateform after 2015. The current usage metrics is available 48-96 hours after online publication and is updated daily on week days.
Initial download of the metrics may take a while.