Fig. 5
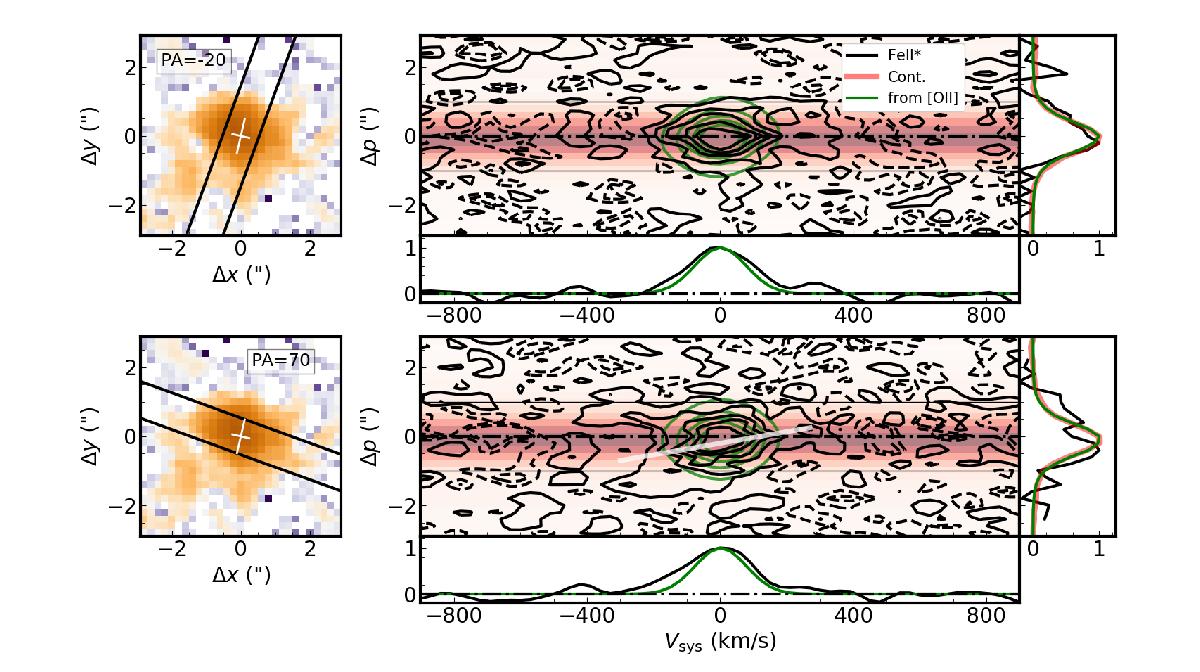
Left panels: narrowband images of the Fe ii* emission optimally extracted from the MUSE cube shown with a 1′′-wide slit oriented −20° (top) and +70° (bottom). The +70° slit orientation in the bottom panels follows the Fe ii* major kinematic axis. The white crosses indicate the galaxy major and minor axes from the Contini et al. (2016) kinematic analysis of [O ii]. Right panels: position-velocity diagrams of the Fe ii* emission from a slit oriented −20° (top) and +70° (bottom). Zero velocity is relative to the galaxy systemic redshift, z =1.29018 ± 0.00006, measured from the [O ii] emission. Solid black contours trace Fe ii* flux levels at 1.2, 3.6, 6, 8.4, and 11 × 10-20 erg s-1 cm-2. Dashed black contours show the negative flux levels at –1.2 and –2.4 × 10⁻²⁰ erg s-1 cm-2. Green contours represent the ISM component estimated from [O ii] (see text). The red gradient indicates the continuum intensity. The right side panel of each p−v diagram compares the spatial profile of the Fe ii* emission (black) with that of the stellar continuum (red) and the ISM component (green). The bottom sub-panel of each p−v diagram shows the total 1D flux spectrum integrated across the spatial region between −1″ and + 1″ in the p−v diagram with the Feii* emission in black and the [O ii] emission in green. In the bottom p−v diagram, the white solid line follows the velocity gradient. This panel also reveals a “C”-shape pattern in the blue wing of the Fe ii* emission extending to –400 km s-1. The blue wing of the Fe ii* emission is more pronounced along the slit orientation corresponding to the minor-axis (PA = + 70°), whereas the red wing appears for both slit orientations.
Current usage metrics show cumulative count of Article Views (full-text article views including HTML views, PDF and ePub downloads, according to the available data) and Abstracts Views on Vision4Press platform.
Data correspond to usage on the plateform after 2015. The current usage metrics is available 48-96 hours after online publication and is updated daily on week days.
Initial download of the metrics may take a while.