Fig. 4
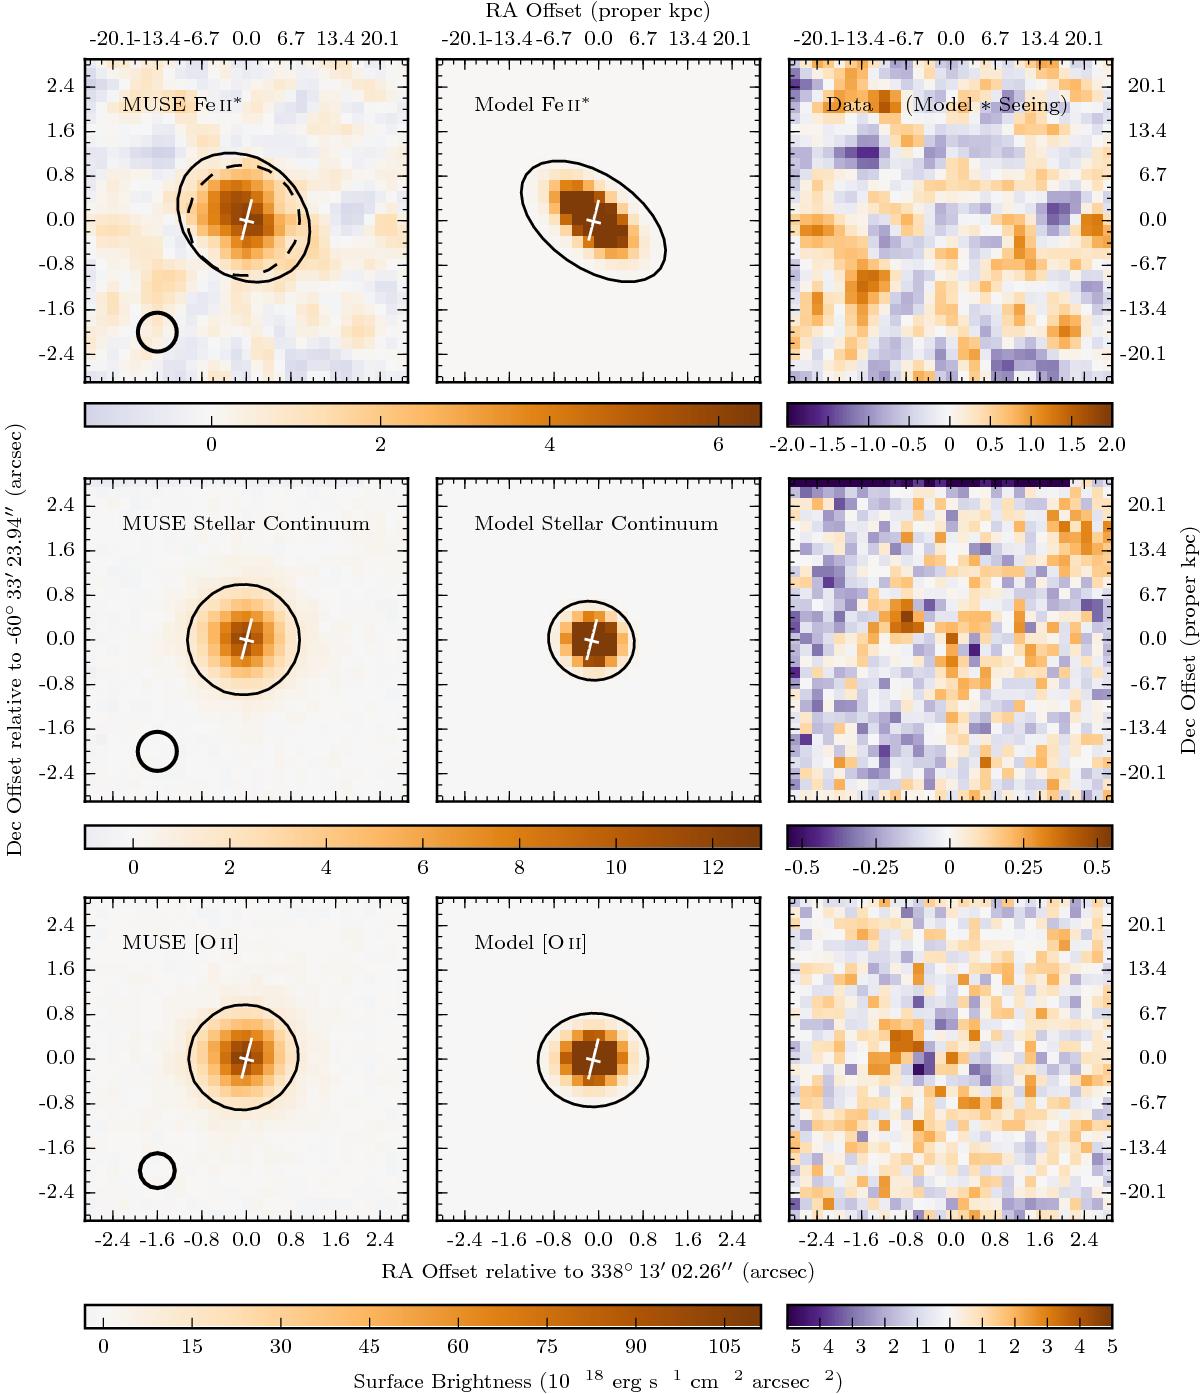
Left panels: Surface brightness maps of Fe ii* (top), stellar continuum (middle), and [O ii] emission (bottom) from pseudo narrowband images (see text). Solid contours represent 1/10 of the maximum surface brightness. The dashed line in the top left panel corresponds to the stellar continuum contour from middle left panel. The small black circles represent the seeing at the emission wavelength. Middle panels: Surface brightness maps of the intrinsic emission from an exponential disk model “deconvolved” from the seeing. Ellipses in the middle column are drawn using the model parameters and have a size that corresponds to the half-light radii (see Table 4). Right panels: Maps of the residuals between the observed data and the intrinsic model convolved with the seeing. In the left and middle panels, white crosses indicate the galaxy major and minor axes from the Contini et al. (2016) kinematic analysis. The Fe ii* emission map is more extended than both the stellar continuum or the [Oii] emission.
Current usage metrics show cumulative count of Article Views (full-text article views including HTML views, PDF and ePub downloads, according to the available data) and Abstracts Views on Vision4Press platform.
Data correspond to usage on the plateform after 2015. The current usage metrics is available 48-96 hours after online publication and is updated daily on week days.
Initial download of the metrics may take a while.