Fig. 3
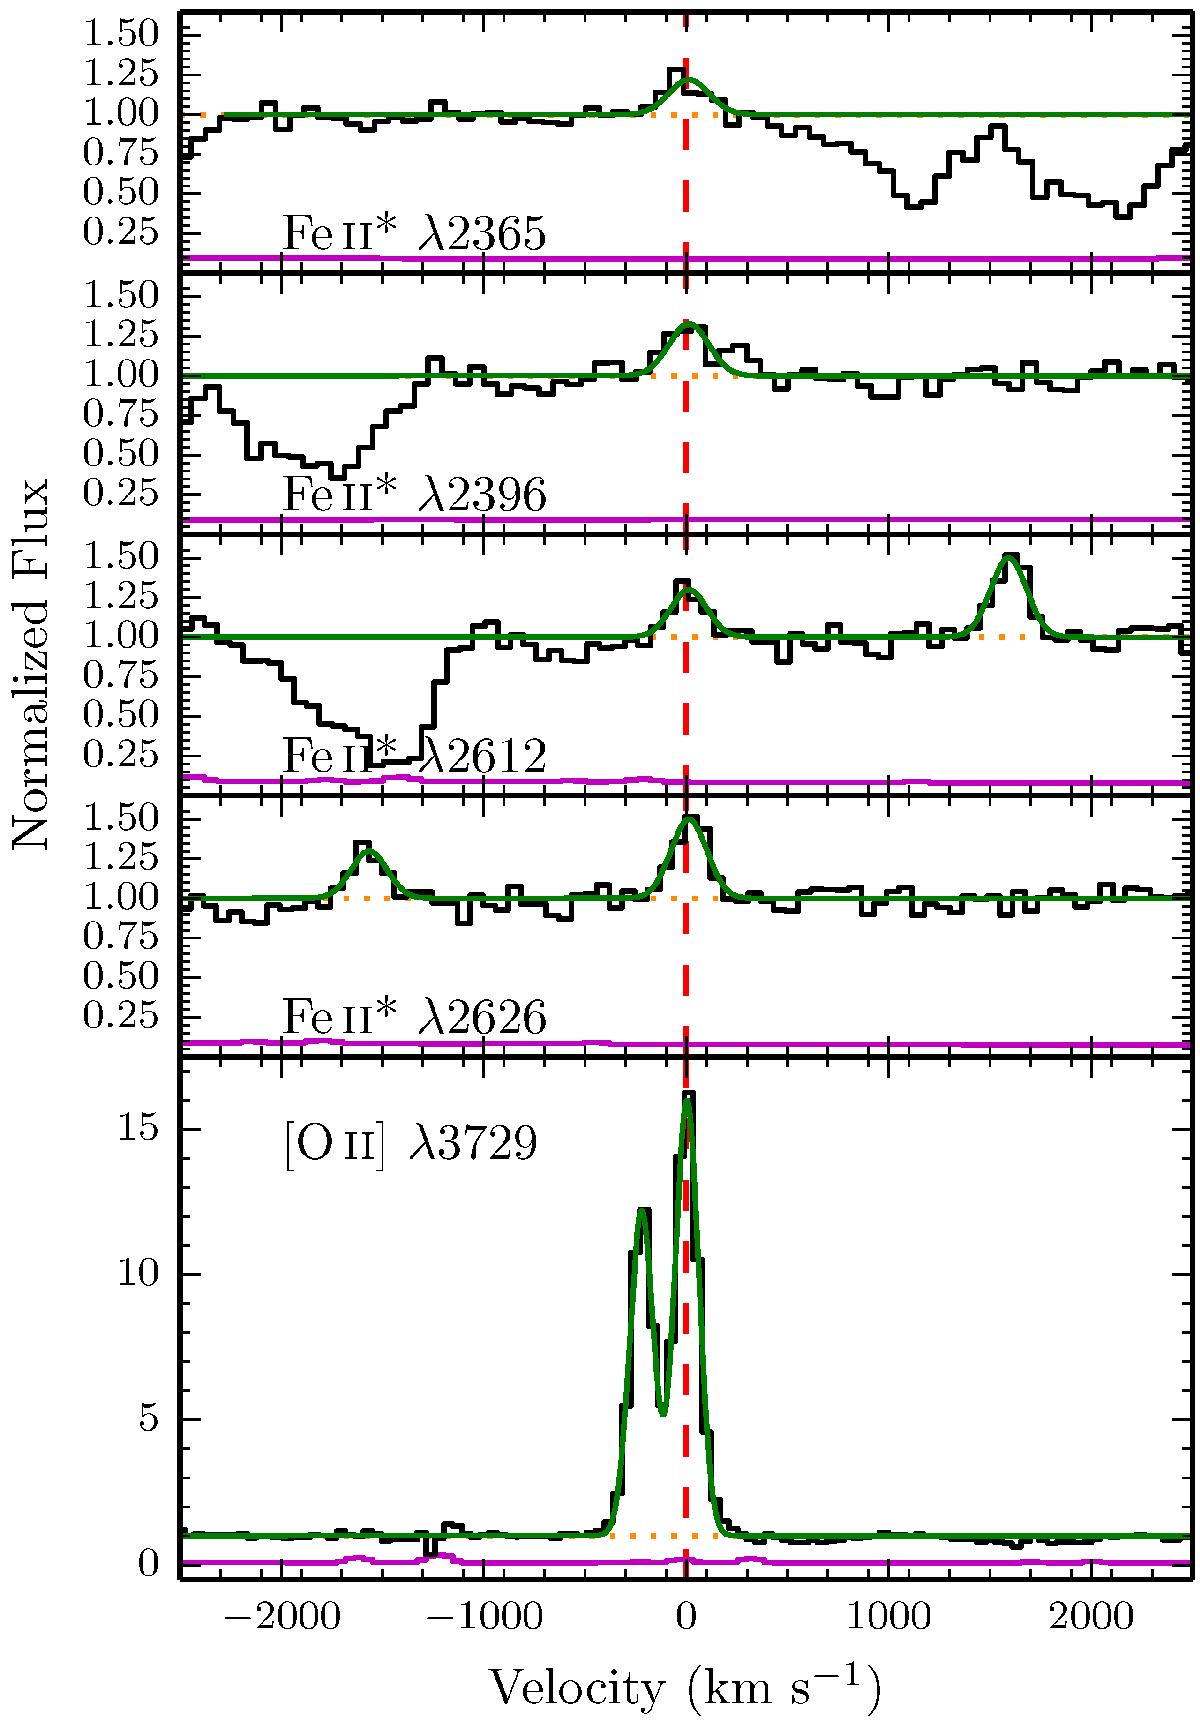
Fe ii* and [O ii] emission peaks detected in the normalized 1D MUSE spectrum. The green curve traces joint Gaussian fits to the four Fe ii* emission peaks and the [O ii] doublet, respectively. Zero velocity, indicated with the vertical red dashed line, is relative to the galaxy systemic redshift, z = 1.2902, measured from the [O ii] emission.
Current usage metrics show cumulative count of Article Views (full-text article views including HTML views, PDF and ePub downloads, according to the available data) and Abstracts Views on Vision4Press platform.
Data correspond to usage on the plateform after 2015. The current usage metrics is available 48-96 hours after online publication and is updated daily on week days.
Initial download of the metrics may take a while.