Fig. 2
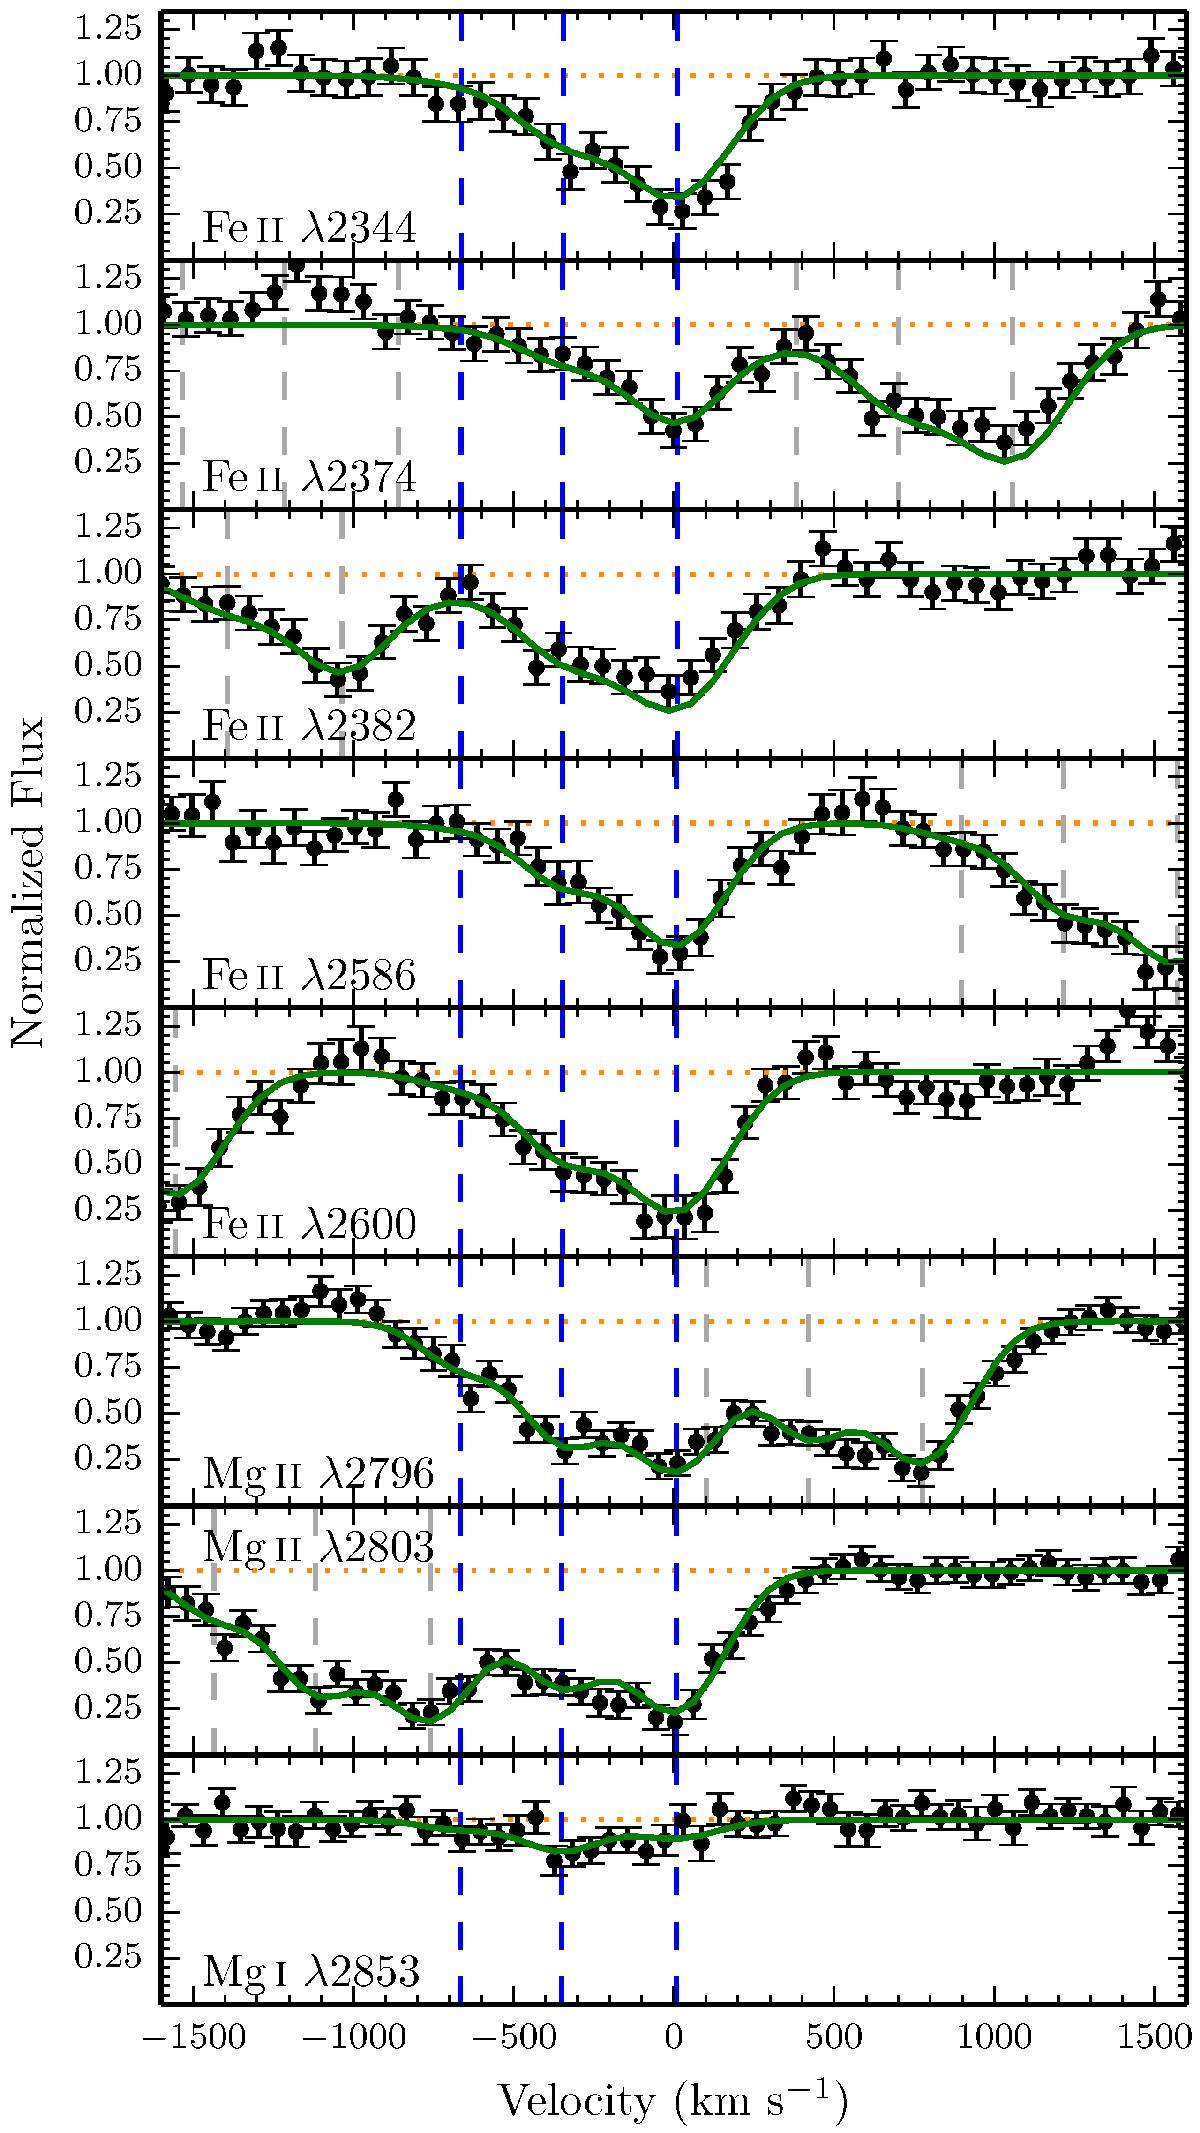
Fe ii, Mg ii, and Mg i transitions detected in absorption in the 1D MUSE spectrum. Error bars show the 1σ error on the flux (black), and the green curve traces the fit to the absorption profiles. Zero velocity is relative to the galaxy systemic redshift, z = 1.2902. Vertical blue dashed lines mark the three components used to fit each absorption, and gray dashed lines show components that are part of neighboring transitions. The asymmetric absorption profiles indicate significant blue-shifted absorption.
Current usage metrics show cumulative count of Article Views (full-text article views including HTML views, PDF and ePub downloads, according to the available data) and Abstracts Views on Vision4Press platform.
Data correspond to usage on the plateform after 2015. The current usage metrics is available 48-96 hours after online publication and is updated daily on week days.
Initial download of the metrics may take a while.