Fig. 1
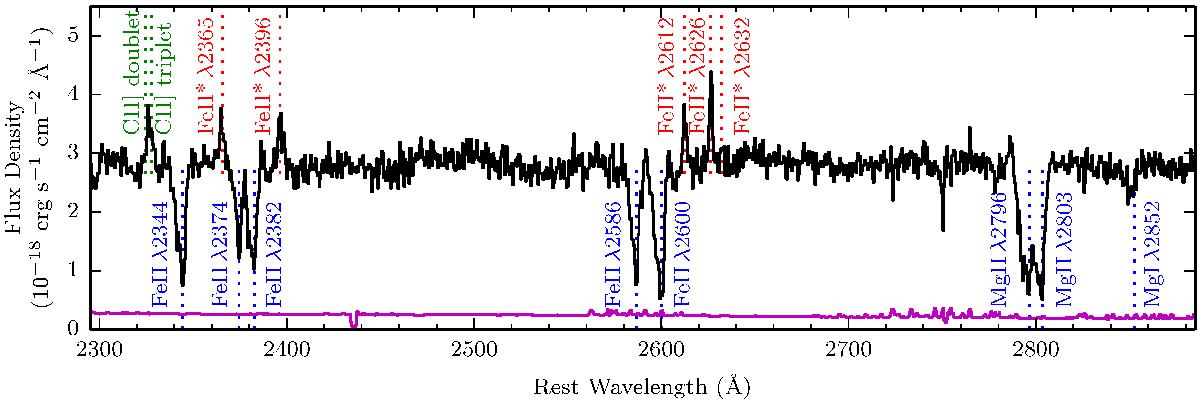
Vacuum rest-frame 1D spectrum of the MUSE HDFS galaxy ID#13 covering the Fe ii and Mg ii transitions. The spectrum is in black with the 1σ error in magenta. Resonant transitions detected in absorption are labeled in blue. Non-resonant Fe ii* transitions detected in emission are labeled in red. The C ii] nebular emission, which is a blend of five transitions, is labeled in green.
Current usage metrics show cumulative count of Article Views (full-text article views including HTML views, PDF and ePub downloads, according to the available data) and Abstracts Views on Vision4Press platform.
Data correspond to usage on the plateform after 2015. The current usage metrics is available 48-96 hours after online publication and is updated daily on week days.
Initial download of the metrics may take a while.