Fig. 9
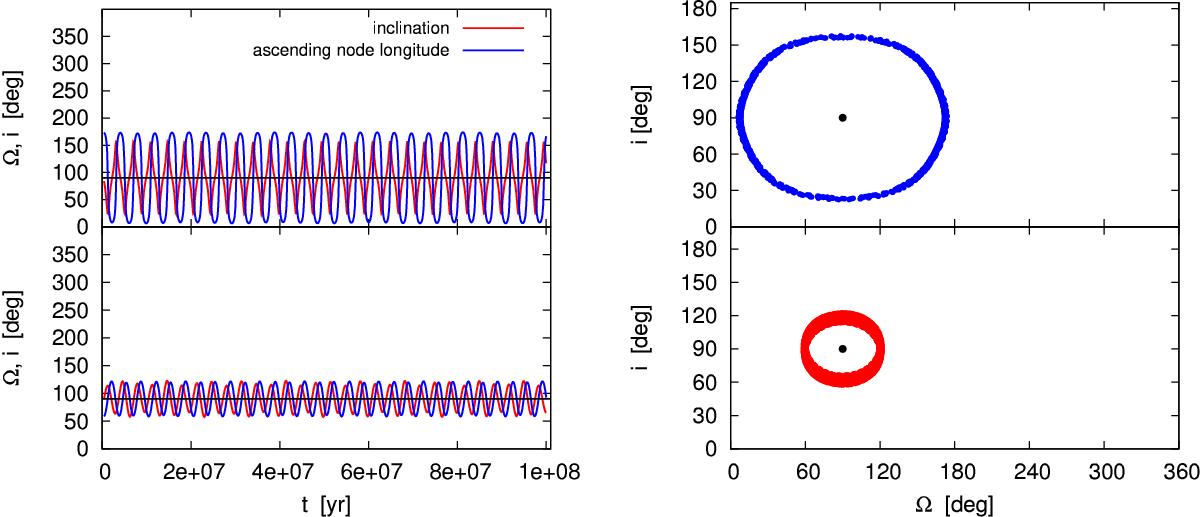
Evolution in time of the inclination i (red line) and the ascending node longitude Ω (blue line) of two different test particles (left side) of the same simulation. On the right side, the coupling of inclination i and the ascending node longitude Ω for the same particles. The red and blue dots show the values of i and Ω for particles flipping with small and large amplitudes, respectively. The black circle represent the center of libration for both angles. The larger the libration amplitude of Ω, the larger the libration amplitude of i. The semimajor axis and eccentricity of the surviving giant planet are a = 0.95 au and e = 0.73. The top panels are represented by a test particle whose post IE orbital parameters are a1 = 11.6 au, e1 = 0.48, i1 = 93°, ω1 = 9.22°, and Ω1 = 173.48°. The post IE orbital parameters for the test particle in the bottom panels are a2 = 21.35 au, e2= 0.74, i2 = 80.3°, ω2 = 167.9°, and Ω2 = 59.7°.
Current usage metrics show cumulative count of Article Views (full-text article views including HTML views, PDF and ePub downloads, according to the available data) and Abstracts Views on Vision4Press platform.
Data correspond to usage on the plateform after 2015. The current usage metrics is available 48-96 hours after online publication and is updated daily on week days.
Initial download of the metrics may take a while.