Fig. 21
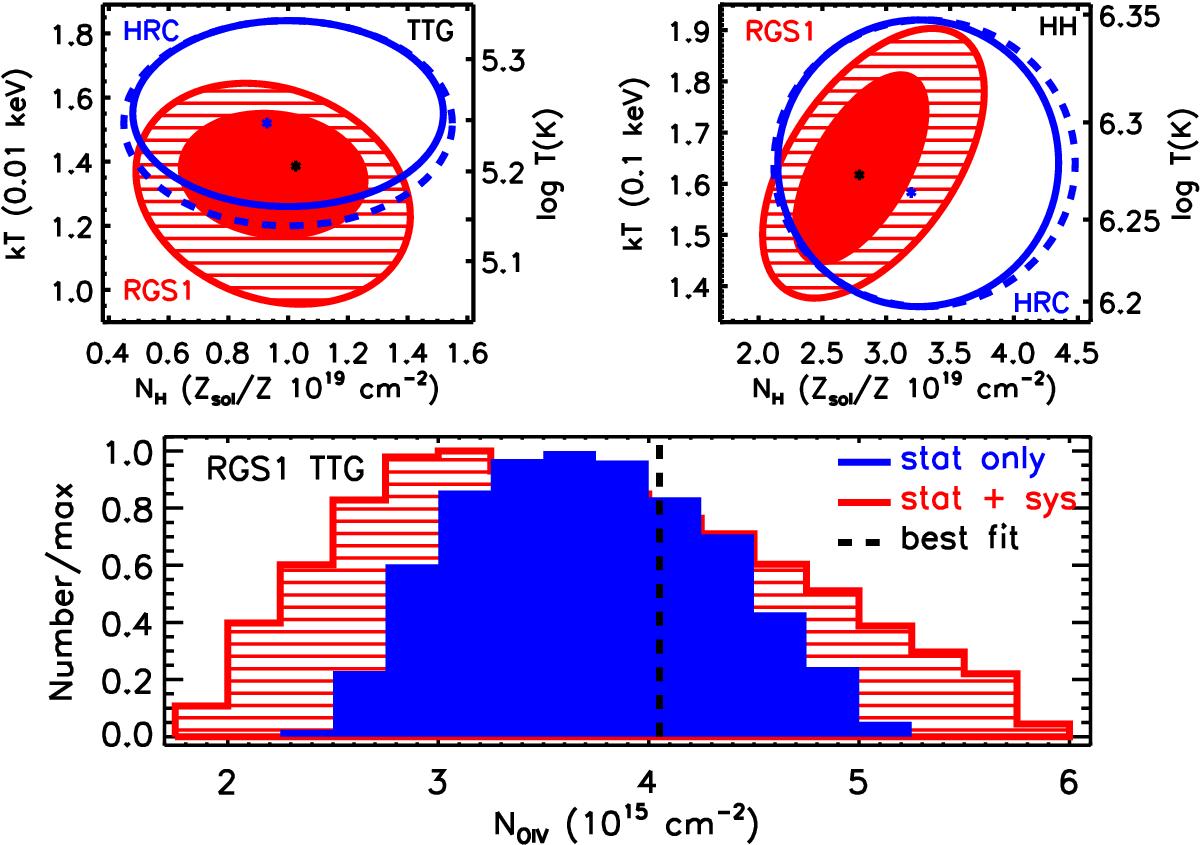
Uncertainties of 1σ in the kT–NH plane for TTG (upper left panel) and HH (upper right panel) for RGS1 (red) and HRC(blue). The results, obtained when using only statistical uncertainties, are indicated with the filled ellipses (RGS1) and solid blue lines (HRC). The red shaded regions and the blue dashed line indicate the results obtained when including the 2% uncertainty for the effective area calibration uncertainty. The global best-fit spectral model parameters are indicated as black (RGS1) and blue (HRC) asterisks. The lower panel shows the distribution of the O iv column density of TTG, corresponding to the allowed RGS1 kT–NH region in the upper left panel. The results obtained with only statistical uncertainties are indicated with a blue region, while the red region shows the results when including the 2% systematics. The dashed line indicates the value corresponding to the global best-fit spectral model.
Current usage metrics show cumulative count of Article Views (full-text article views including HTML views, PDF and ePub downloads, according to the available data) and Abstracts Views on Vision4Press platform.
Data correspond to usage on the plateform after 2015. The current usage metrics is available 48-96 hours after online publication and is updated daily on week days.
Initial download of the metrics may take a while.